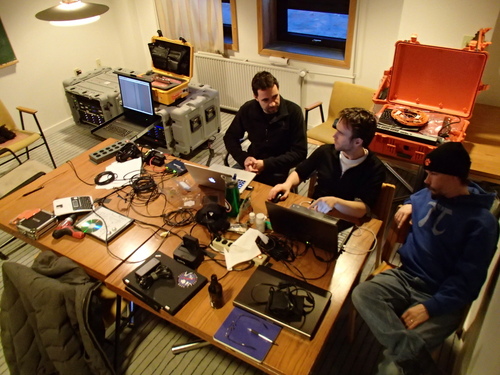
 An overview of the warmest room in the building. There are the equivalent of 68 computers running in this picture.
Let’s recap. There are nine instruments flying on the aircraft: four radars, two laser altimeters, two camera systems, a positioning system, and a partridge in a pear tree. Each of those, except the bird, collects data during each mission. How much data? A total of around 2 terabytes (TB) per day. That’s 2,000 gigabytes or 2,000,000 megabytes. In English that’s one trillion bytes of data, and just in case you want more numbers, there are 8 bits in a byte, so about 16 trillion bits of data get recorded in flight.
Watch this:
The person responsible for keeping track of all this data is Aaron Wells from Tulsa, OK. Aaron attended Tulsa University and Oklahoma State. He now works for the Campus Bridging Research Infrastructure Team which is part of the Persuasive Technology Institute which is part of Indiana University in Bloomington. Say that three times fast.
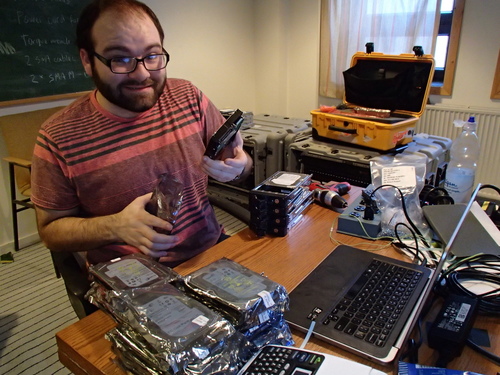 Aaron Wells in the middle of changing drives.
Why does NASA use a university to manage their data? NASA pairs with all kinds of educational institutions, that’s part of the reason I’m here. NASA makes it one of their main goals to work with educational partners to not only educate people about what they do, but to train the next generation of scientists and engineers. As a teacher, I find it refreshing when an organization, like NASA, thinks that far into the future. In the days of immediate profit and instant gratification, I feel pretty good that a group like NASA is investing in the long term.
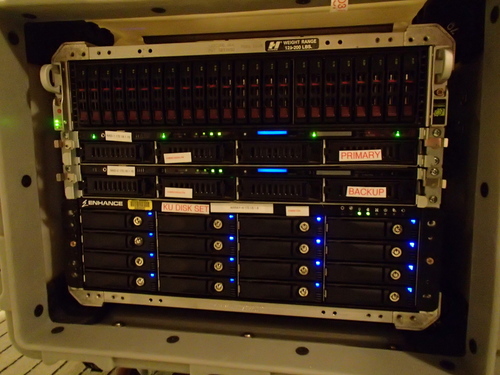 This is where they store the data.
Back to the data. Indiana is a good choice for data because they have some of the biggest and fastest computers in the world. They just put a new Cray supercomputer on-line called Big Red II. To analyze and study all the data IceBridge collects; it’s nice to have a fast machine.
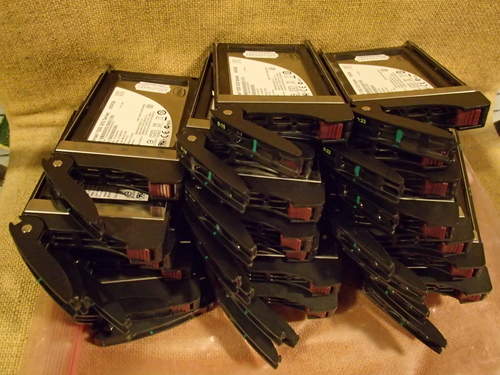 Just a few of the drives needed to store the 200+ TB of data Operation IceBridge will collect this spring. For comparison, the printed collection of the Library of Congress would occupy 10 TB.
Before getting off the plane at the end of the flight, Aaron packs about 20 300 GB Solid State Drives into his backpack. If you’re doing the math, that actually works out to 6 terabytes. That’s because all the data is backed up as it’s recorded and there’s some ‘overhead’ involved as well. My favorite quote from Aaron is, ‘Never underestimate the bandwidth of a backpack.’
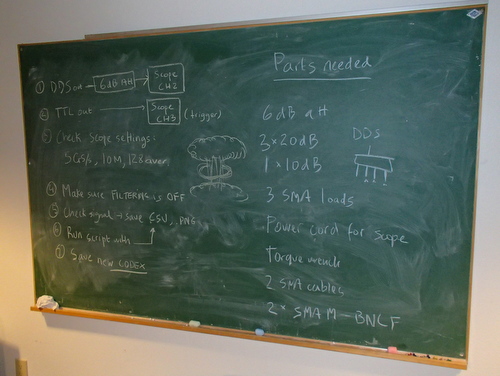 This made me feel a bit more at home. If you can decipher this, there may be a job for you at IU or KU.
Aaron has a portable lab set up in one of the dorm rooms and he immediately begins transferring the data from the SSD’s to his server array. He has the ability to store 250 TB of data before calling for more drives. It takes about 8 hours to transfer the 2 TB off the SSD’s – just enough time to be ready to do it again.
Only because I know a couple people want more: the array is made of Seagate SAS drives and uses RAID 6 or block-level striping with double distributed parity. Got it?
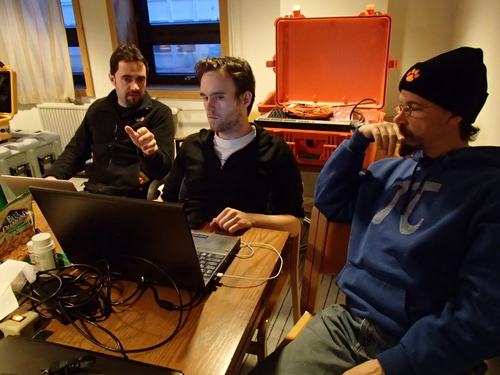 Logan, in the middle, works with two of his team members to solve a problem.
Also working with the data is Logan Smith. Logan did his undergrad at St. Olaf in Minnesota and is now an electrical engineering grad student at the University of Kansas’ Center for Remote Sensing of Ice Sheets. Logan begins processing the data from the four radar systems as soon as it comes off the plane.
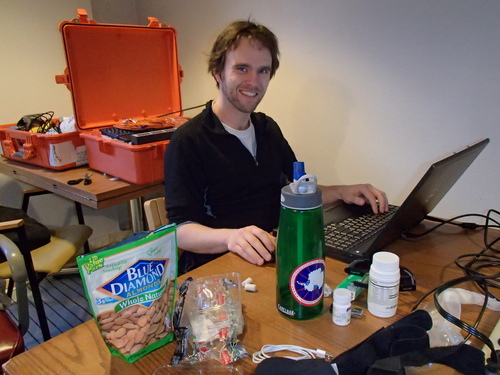 Logan Smith from KU checks the data and generates some amazing images from that data.
Logan’s job is threefold. First, check the data to see if it’s ‘good.’ Is there too much noise? Are the signals saturated or too weak? Second, he produces images from the data. Remember the raw data is literally 1’s and 0’s. Logan can work some magic. Actually he can run a variety of computer programs to change the raw data into visual images that are easy to interpret. Here is one of the images, and you’ll see a lot more of his work in the up-coming journal about the radars.
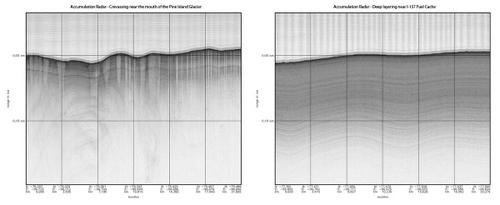 Some beautiful and informative images can be generated out of the data collected. Image courtesy of NASA/CReSIS.
In order to generate images like this from 2 TB of data, he brought with him an array of 64 2.3 GHz processors. Think 64 MacBook Pro’s or fast PC’s. Yeah, that’s pretty cool. Actually they’re not cool; the room Aaron and Logan work in is the warmest room in the building because of all the computers running.
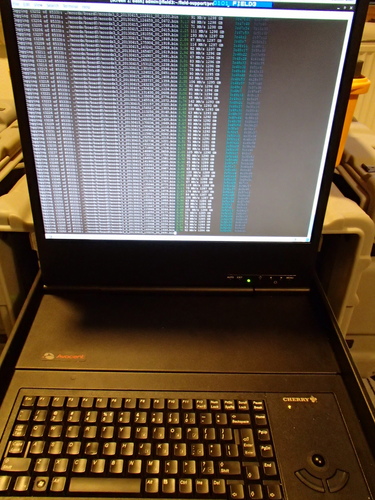 This is actually connected to 64 processors.
The third task for Logan is to send some of the data back to KU. He obviously can’t send it ALL back, but they send back samples so the rest of the team in Kansas can also check the data and provide feedback to the engineers in the field. In science it’s always a good idea to get more than one person looking at the data. You might even call it a requirement.
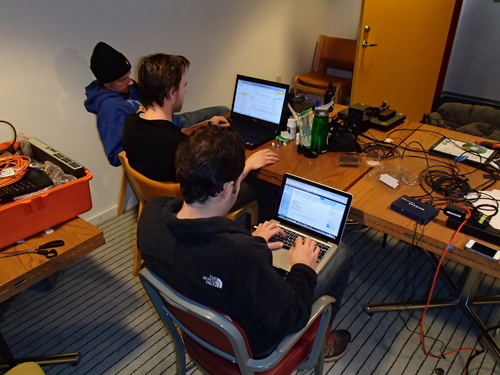 They spend a lot of time on computers analyzing the data Operation IceBridge collects.
So how does all this data get back to IU and KU? It flies back on the P-3 and then a truck drives the data from Virginia, drops off one copy in Bloomington, IN, and finishes its delivery in Lawrence, KS. It’s cheaper and faster to deliver it by truck than to try to transfer 200+ terabytes of data over the Internet. NASA, working with IU and KU, has a requirement to make all their data publically available within six months of the P-3 landing in Virginia. In six months you, yes you, could write the National Snow and Ice Database in Boulder, CO, and get the data that was collected while I was with Operation IceBridge. Be sure you have a fast Internet connection if you really want the data :-)

