How do you see through the snow and ice? Especially when it can be more than 2 miles thick? The answer: RADAR; an acronym for RAdio Detecting And Ranging. NASA’s Operation IceBridge has four different kinds of radar.
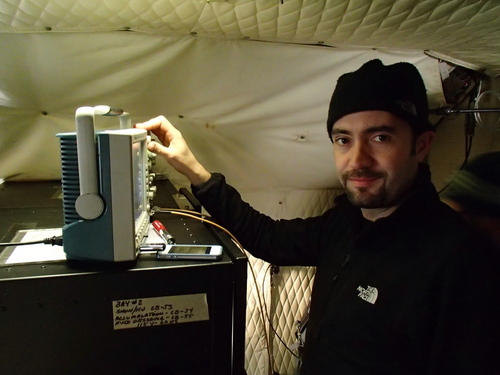 Bruno Camps-Raga checks the radar.
First, what is radar? It’s a wave of energy produced by electrons converting electric potential energy into electromagnetic energy. What? Okay, you know that a radio station’s antenna sends out radio waves and a cell phone sends out a ‘signal’ so it can talk to the cell towers – those are more technically known as electromagnetic waves. Visible light is an electromagnetic wave. Visible light differs from radio waves only in frequency. Infrared, ultraviolet, and x-rays are other types of electromagnetic waves. They are all part of a big ‘family’ or spectrum of electromagnetic waves. If you want to be cool, you can refer to them as em waves, pronounced ‘ee-em.’
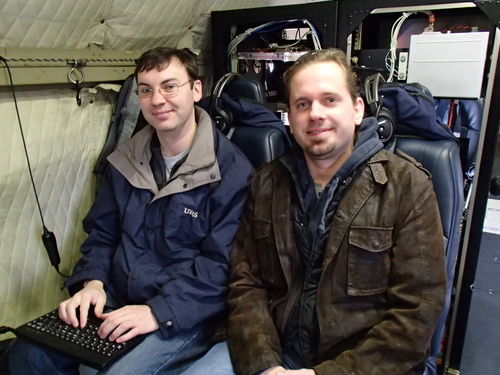 Matt Linkwiler and Rob Russell get ready to collect some data.
So let’s study the IceBridge radars one at a time. We’ll start with the highest frequency radar and work to the lowest frequency radar. The highest frequency radar is called the Ku radar. The Ku radar operates between 12 and 18 gigahertz or GHz. The physics of radar and ice is that the higher the frequency, the more it’s absorbed by the ice. The lower the frequency the less it’s absorbed by the ice or the further it can travel through the ice. Since the Ku radar is higher frequency, it can only ‘see’ a few meters into the ice. However a higher frequency means a shorter wavelength, so it has the best resolution – it can see in the finest detail. It is basically used as a radar altimeter and data from the ATM can be compared to the Ku radar. Satellites also use Ku radar in order to penetrate the atmosphere, but that’s a whole other story.
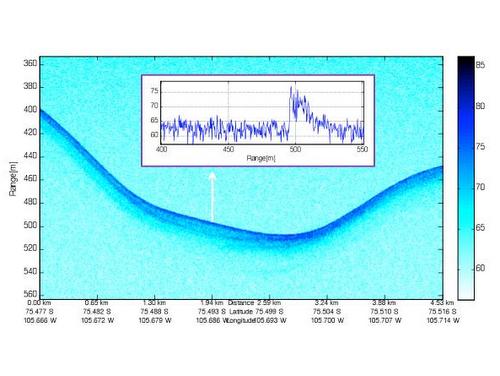 This image is generated from the Ku radar. Courtesy of NASA/CReSIS.
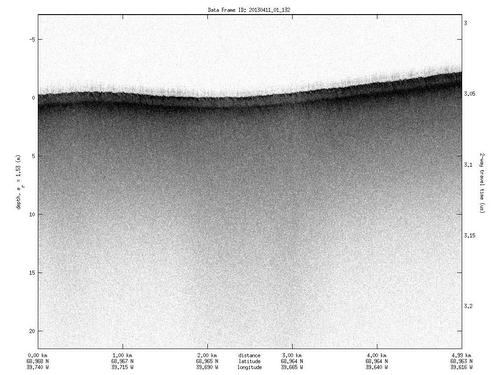 The Ku radar only 'sees' a few meters into the snow and ice, but can generated very detailed images of the surface. Courtesy of NASA/CReSIS.
The second highest frequency radar, is simply called the snow radar. It operates between 2-8 GHz. Your microwave oven heats food by using 2.45 GHz electromagnetic waves. The snow radar can penetrate a few tens of meters into the ice, and because the frequency is still relatively high and its wavelength relatively short, it can generate images with good resolution. Does it make sense why it’s called the snow radar? It can see the snow on top of either sea ice or glacial ice.
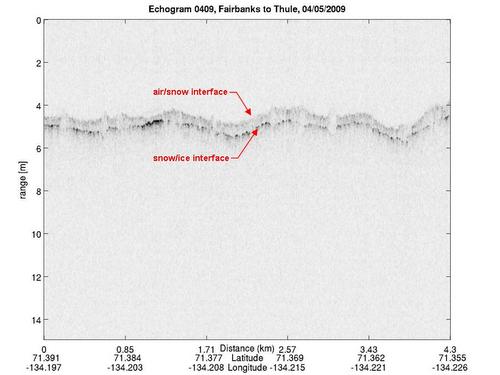 The snow radar with the surface and snow-ice interface labeled. Courtesy of NASA/CReSIS.
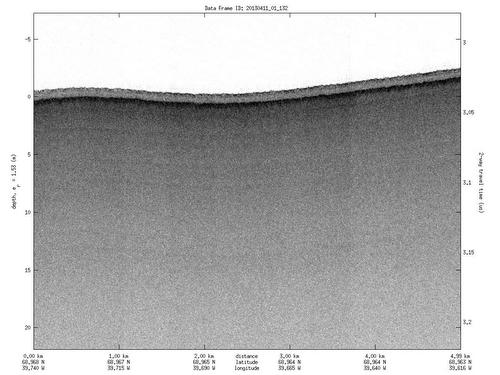 This image is generated from the snow radar data. Courtesy of NASA/CReSIS.
Wait, how are wavelength and frequency related? Take a look:
The accumulation radar is next and it operates between 600-900 MHz. Things like GSM cellular phones, cordless phones, and wireless speakers operate around these frequencies. With a lower frequency the accumulation radar can penetrate hundreds of meters. It can see the accumulation of snow and ice layers going back centuries. With its longer wavelength it doesn't have the resolution of the higher frequencies, but the images are still stunning.
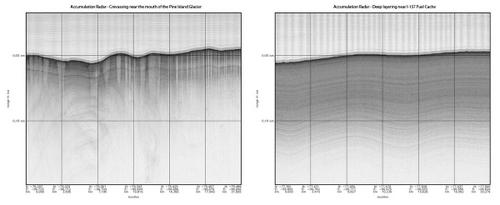 These images are generated from the accumulation radar data. Courtesy of NASA/CReSIS.
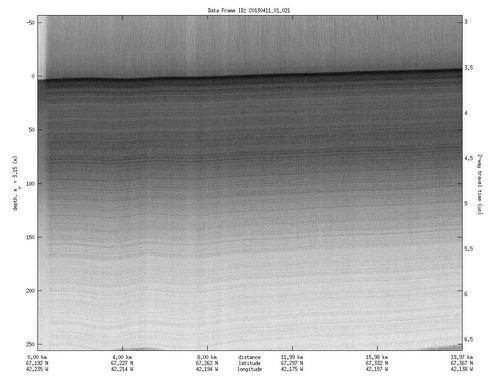 This image is generated from the accumulation radar data. It's practically artistic. Courtesy of NASA/CReSIS.
The lowest frequency radar is called MCoRDS which stands for Multi-channel Coherent Radar Depth Sounder. At 180-210 MHz it can pass through miles of ice. MCoRDS isn’t even used to ‘see’ ice; it is used to see the bedrock below the ice. If you know where the top of the ice is with the Ku radar and you know where the bottom of the ice is with the MCoRDS, then … are you with me? That’s right! You can calculate the thickness of the ice! MCoRDS has helped measure ice thicknesses of 2 miles in Greenland and 3 miles in Antarctica.
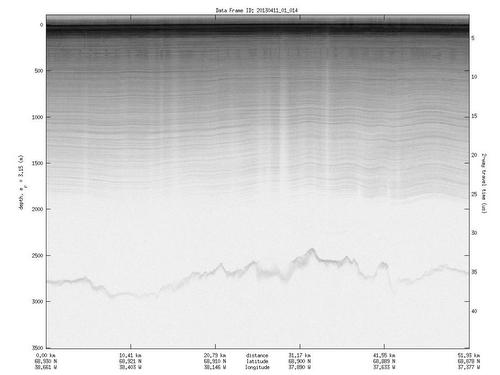 The line in at the bottom of this image is the bedrock -- about one-and-a-half miles below the surface of the ice. Courtesy of NASA/CReSIS.
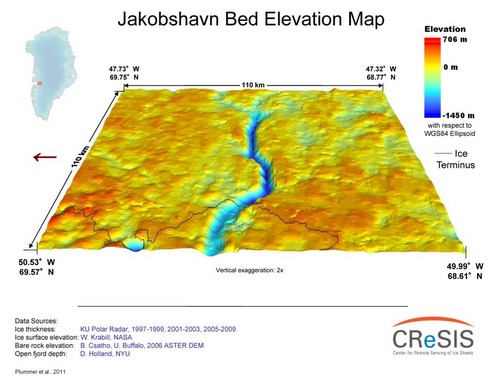 These are the kind of images that can be generated from the MCoRDS radar data. Getting a detailed look at the ground below the ice can help scientists understand how the glaciers are changing. Courtesy of NASA/CReSIS.
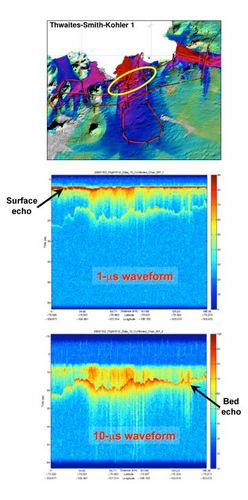 More incredibly detailed MCoRDS radar data images. Courtesy of NASA/CReSIS.
Since MCoRDS must travel through the most ice, it is also has to be the most powerful, and it puts out around 100 watts per channel. That might not sound like much but the other radars put out 10 times less power. MCoRDS is the only system that has an antenna array on the outside of the plane; all the other antennas are in the bomb bay.
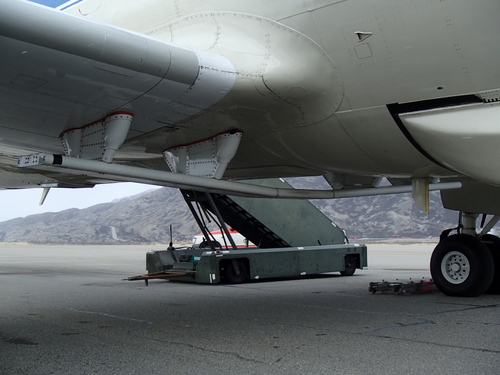 The wing-shaped fairing houses the MCoRDS radar antenna array. It's the only one outside the aircraft. The other three antennas are in the bomb bay.
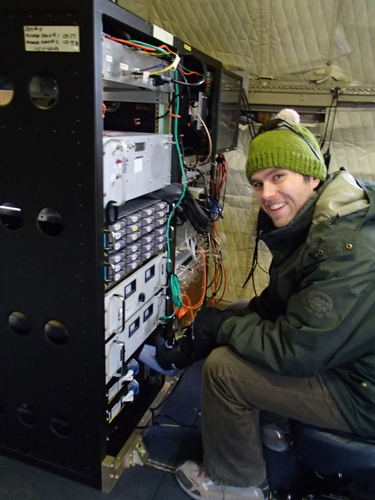 Logan Smith uses a hair dryer to warm up the radar on a cold morning. In remote locations and under extreme conditions, engineers must be innovative.
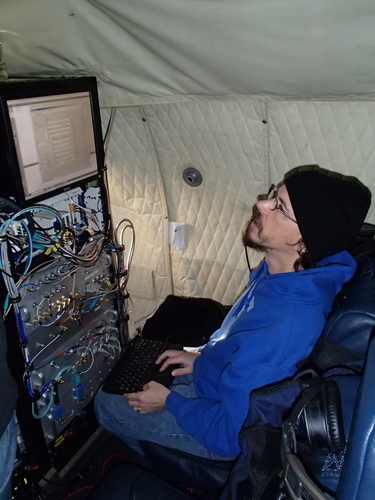 Jay Fuller checks on the Ku, accumulation, and snow radars.
Here is an interview with engineers Bruno Camps-Raga and Robert Harpold: http://youtu.be/V8ElrFe4Yy0
And here’s an interview with radar engineer Bryan Townley: http://
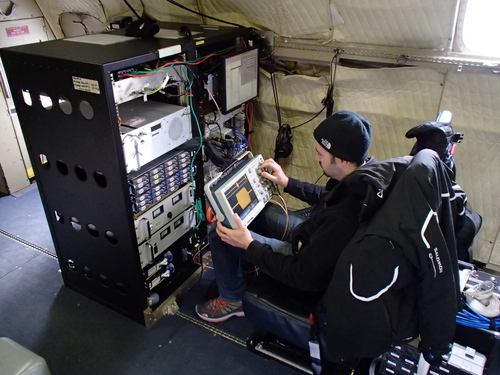 Bruno Camps-Raga checks the MCoRDS radar on an oscilloscope.
If you are still reading … congratulations, you made it to the end of my last truly nerdy journal. Thanks for following, or trying to follow, along!

