Journal Entry

First Flight

Today marked my first flight aboard the P3 aircraft. I walked from my room in the KISS building over to the plane this morning around 7 am - about a 5 minute commute. The only things that spoiled my otherwise pleasant stroll was the drone of the P3's APU unit in the background (the Auxiliary Power Unit - the noisy generator that powers all jet aircraft when they are on the ground) and the temperature, about -15F. I would later learn that this temperature set an all time record low for the date here in Kanger.

Walking to the planeMy morning commute at -15F.

When I arrived at the plane the engine heaters were on in full force, pre-heating the engines so we can start them. Many Alaskan aviators are likely familiar with such an ordeal.
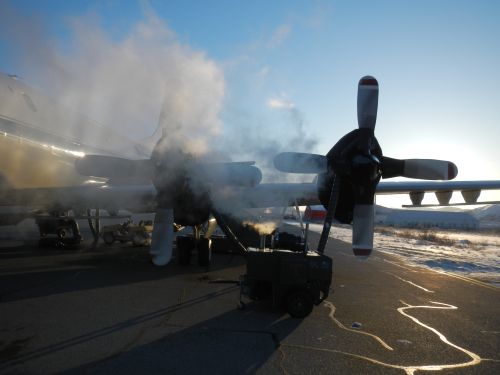
Engine heatersThe heater blast hot air into the insulated engine covers. This pre-warming is necessary when the temperatures are below zero.

I measured the APU's deafening noise at 100 dB near the plane and about 85 dB inside it. Once the engines started the noise level in the back of the plane rose to 90 dB while the front - closer to the engines - registered 95 dB.

Inside, scientists, technicians, and the flight crew busied themselves with pre-flight preparations. Hard drives had to loaded and warmed, lasers and radars warmed up and turned on, calibrations made. The millions of dollars of equipment on the plane sat out overnight without heat so just like everything else the computer equipment had to be heated prior to use. And they used hair driers - euphemistically called "auxiliary thermal thermal supply units" - to accomplish this.

Overview of Operation Ice Bridge

Operation Ice Bridge (OIB) is the name of the current iteration of NASA-sponsored glacier and ice arial mapping programs. The have been doing this kind of data gathering for nearly 30 years under different names and with techniques. Some of the current members of the OIB crew date back to those early days of rudimentary technology and crude data gathering.

OIB employs a P3-Orion airplane (known to many as the "hurricane hunter") that flies over the glaciers and ice sheets of the polar regions once each year, gathering reams of data along the way. The P3 is outfitted with the following equipment:

-A half dozen sophisticated GPS systems that allow the plane to fly the same flight path one year to the next with an error of less than 50 feet.

-Two digital cameras pointing straight down that take 20 megapixel photos once each second. These photos will be layered on top of the laser data to create incredibly accurate 3D renderings of the ice surfaces.

-Four different types of radars which measure... The snow depth and layers on top of the ice. The layers of ice within the glacier (accumulation radar). The depth of the bedrock below the ice (accurate to 1 meter or so). The altitude of the surface of the glacier.

-Two laser airborne topographic mappers (ATM), one wide angle one narrow angle, that measure the shape of the ice surface across a 400 meter wide path with a resolution of 10 cm.

-An albedo spectrometer measuring the reflectivity of sunlight off the ice/snow surfaces

-An infrared radiometer which measures surface temperature

Together this suite of data taken over time provides invaluable data about the changes in the snow and ice volume throughout the polar regions. Generally speaking these scientists do not use the data collected to publish scientific papers but rather give the data to the National Snow and Ice Data Center (NSIDC) where anyone can access it. They literally send hard drives full of terabytes of data back to the NSIDC every few weeks.

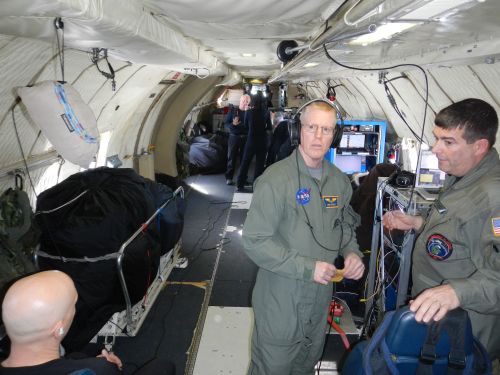
Inside the P3A glimpse down the row of equipment stations. Inside the P3Another view down the fuselage to give you a sense of scale for the inside of the plane.
Looking Ahead

Over the next couple of weeks I will interview the scientists, pilots, and engineers that make up the OIB team. They will describe in detail how their equipment works as well as their individual backgrounds that got them to where they are now. (Hint: They took more than one physics class!)

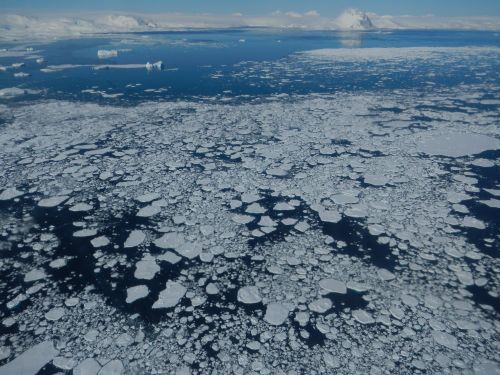
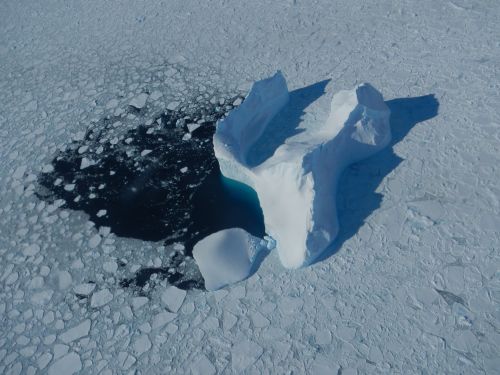
For the time being I'll leave you with a few photos from the shores of southeastern Greenland where the bulk of our flight took place today. Along the sea ice margins we could see numerous sets of polar bear tracks and seal holes. But we did not see any polar bears themselves :( We also saw one iceberg that extended a few hundred feet out of the water. It wasn't very far below our plane, which was at 500 feet at the time!

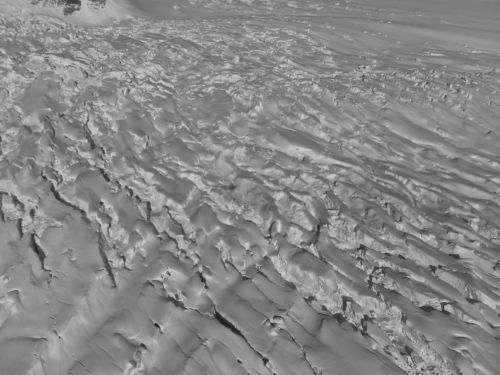
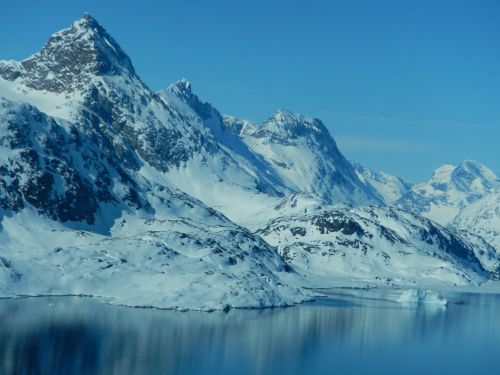
IcebergA puzzle piece iceberg. Crevasses.Crevasses in the ice. SE GreenlandSoutheast Greenland Mountains along the oceanMountains along the ocean Sea iceSea Ice IcebergIceberg

Greenland certainly has a beautiful coastline!

Comments

Guest

Do the scientist on board the aircraft believe we are experiencing global warming trend and is this year only an aberration?
Great pix.

Stan

Guest

Russ -
How often do you fly? Do you fly a different route each time? How long are you in the air for each trip? Do you always low to the terrain? What will you be doing when you are not flying?

The blogs have been very informative. The pictures are great - very professional. Keep up the good work.

My

PS U Conn won both the Men's and Women's BB.

Russell Hood

We fly every day the weather allows except Sunday. The airport here is closed three days of the week, one of which is Sunday, and that day is
used to maintain the plane, catch up on emails, clean the equipment,
etc. To fly on the other two days our program pays the airport to open
up for us. That includes fuel, air traffic control, firefighting
standby, etc. We have to "rent" it in three hour blocks as that is the
minimum.

We fly a different route each day. Greenland has 72 routes or so and
there are far fewer days available than that. The navigator, whom I'll
interview later, prioritizes the routes. Yesterday, for example, was a
high priority route over the most active glacier in the country: Jakobshavn.

We are in the air for 8 hours or so per day. The plane can fly for
something like 12-14 hours if necessary. We keep a large margin of
extra fuel onboard (as is the case with all safety-related issues).

We fly between 500-1500' above the surface of the glaciers, sea ice, or
ocean. It's a middle ground between better data (lower) and more
coverage (higher). It's pretty fun, especially when we fly the edges of
the ice cap. I've seen flocks of birds, and lots of polar bear tracks,
but no PB's yet. I'll post a video soon from the cockpit camera to give
you a sense of what it's like. There are also times when we're flying
for hours over the ice sheet which is when everyone eats lunch, naps,
etc. It's a bit more tedious then. Even so, looking at the wind
patterns in the snow, the random frozen lakes, etc. is quite interesting.

Thanks for the sports update.

Russell Hood

Good question. One of the longest term scientists is eating breakfast with me right now. I read your email and his response is this: In 20
years of measuring the glaciers here in Greenland they have not seen one
year where the ice extent has increased. Every year it has decreased,
some years more than others. All of their data (thickness and lateral
extent) is consistent in this.

No one thinks that this year was an aberration. The lower 48 was colder
and wetter than normal this last winter, but that was there. In Alaska,
Europe, the Sochi Olympics, etc. they all experienced warmer and drier
winters than normal. So it's not fair to use any single location's
weather for a given season as evidence of anything. What is certain is
this: on average the northern hemisphere was warmer this winter than the
long term average, even if the continental US didn't see it. And that
warming trend has been very consistent over last few decades(with
perhaps minor aberrations here and there, but the trend is certainly
been toward weather).

I'll try to get some more pictures, videos, and scientist interviews
coming up soon.

Thanks for writing.

Peggy McNeal

Wow! Fascinating research and beautiful pictures, Russell. Thanks for another informative journal. My students will connect soon. We have two weeks of Spring Break and many are on the Washington DC history field trip. I'm looking forward to reading more.

Guest

Thanks for the updates. This looks like a lot of high tech tools for measuring a piece of a worldwide problem. Is similar data with similar techniques collected in Antarctica?

Russell Hood

Thanks for keeping in touch, Peggy. I'm really enjoying my time here and have been learning a ton about climate science. Fun stuff!

Russell Hood

Yes. The OIB team takes their equipment to Antarctica each year as well. In that case they use a modified DC8 jet instead since it has a
longer range. They are based out of Punta Arenas, Chile for that
mission and fly the plane to Antarctica each day! Quite a commute, to
say the least. I'll be posting some of their recently released
Antarctic data - remind me in case I forget to show you that.

Mark Buesing

Stunning pictures. Great color balance. What are you shooting and are you doing any post-processing?
Keep up the excellent journals!

Russell Hood

Thanks. To answer your question: Oh, yeah. To be honest, Mark, I'm disappointed in my camera's performance. It's a reasonably nice point
and shoot but some of the crew also have nice P&S's that are kicking
mine's butt. Most of my pictures are coming out flat and blue. I'm
having to rework them quite a bit to get them to better approximate
reality. I did bring a second, and technically better P&S that I'm
going to work with a bit more today to see if I can get better results.
But as I said, some of the other guys are getting perfectly balanced
shots right from the start using their AUTO setting. And some of these
are older cameras. Maybe it's just operator error. I'll update you on
how this fight with my cameras proceeds.

Thanks for writing!

Guest

Hi Mr. Hood,You seem to be enjoying your time there. The pictures are amazing and Greenland looks beautiful.
How long do you think it will take for the polar ice to melt to half of it's current size?

Guest

The comment above is from sherrie yang.

Russell Hood

Sherrie-
I've asked around the science team and nobody has an answer for your
question. The "half-life" of the Greenland ice sheet is difficult to
model as there are myriad inputs that have to be taken into account.
Suffice to say even if it keep melting it won't be down to half the
current size for some time. But when we DO get to that point, the sea
level will rise by about 3.5 meters from the Greenland ice melting
alone. Presumably there would be a concurrent melting of ice in other
locations that would also add to that value. This would put a large area
of land under water including cities that hold millions of people.
To put some of this in perspecitve: One glacier in Greenland, when last
measured, discharged about 120 cubic km of ice - IN ONE YEAR!

Good question!

-Mr. Hood