Jacobshvn Glacier
On April 15, 1912 the HMS Titanic struck an iceberg and sunk within two and a half hours, taking 1500 lives with her. Almost certainly the iceberg had calved off the Jakobshavn Glacier of Western Greenland.
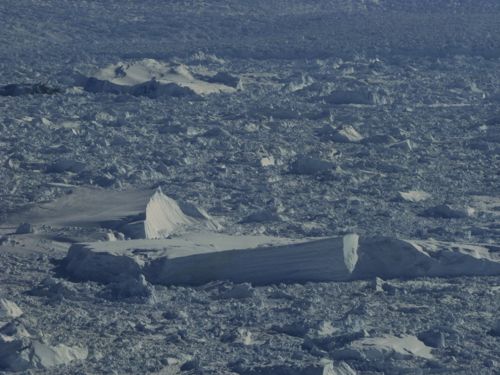 Looking over sea ice and icebergs toward the ice front of the Jakobshavn Glacier.
The largest and fastest moving glacier of Western Greenland, the Jakobshavn produces prodigious amounts of ice the float out into the Nares Strait before ocean currents carry them south into the North Atlantic. Currently this glacier is losing approximately 30 cubic km of ice per year!
Before leaving each morning the crew performs various equipment checks and calibrations. The Airborne Topographic Mapping (ATM) laser is one device which needs daily attention. This laser is powerful enough to damage a person (or animal's) eyes instantly and great care is taken to turn it on only when flying over uninhabited areas. The glass that the laser shines through must be cleaned very carefully so as not to scratch it as it has a special anti-reflective coating on it that is "tuned" to that specific wavelength (532 nm - green). [AP Physics students: Take note! You will be learning about thin film interference soon enough and this is exactly how that coating works to create destructive interference.]
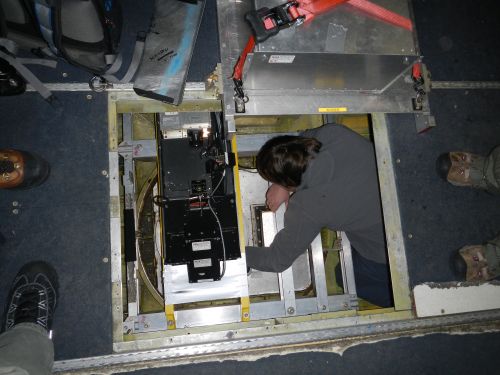 Alexey cleans the glass on the laser port every morning before we fly.
Our route over the Jakobshavn glacier is anything but random as this screen shot shows. Our flight path today over the Jakobshavn Glacier consists of two different-sized grids plus a run straight up the glacier over the area that has the highest velocity (which is determined by satellite radar). The tighter grid lines indicate the area that had been surveyed in the past - which we repeated - but recently the glacier has shown notable crevassing and thinning throughout a much larger region and so the original grid had to be expanded. That explains the larger flight lines superimposed over the older, smaller grid. In the collection of approximately 72 possible Greenland flight routes, this one has a high priority and so must be done each year.
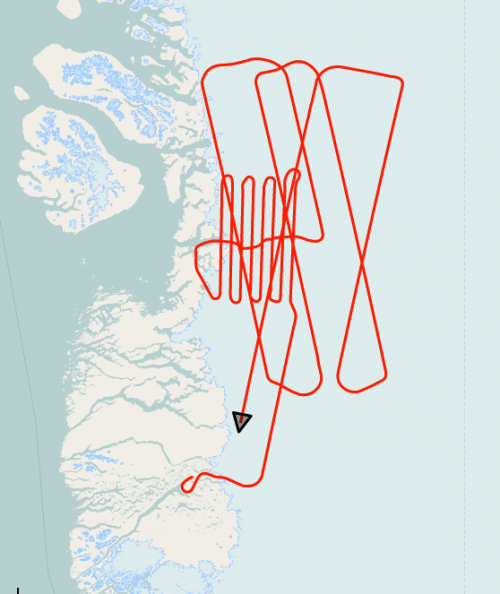 Jakobshavn Glacier flight route for April 9, 2014. The original grid had to be expanded since the area of thinning has increased in recent years. Image courtesy of NASA, Operation Ice Bridge 2014
This next screen shot shows the original, smaller flight grid on a Google Earth map.
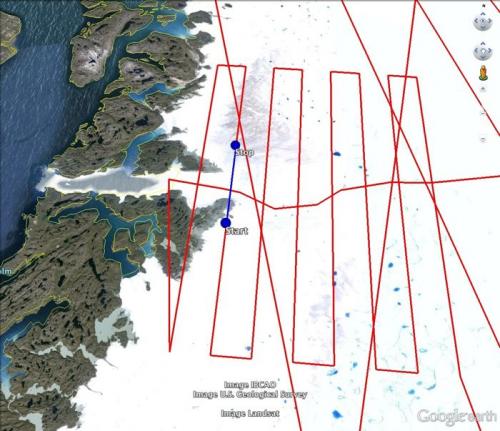 A close up view of the tighter grid in the Jakobshavn Glacier area. Image courtesy of NASA, Operation Ice Bridge 2014
Now the really interesting ones. The image below is color-coded to represent elevation above a neutral mean. It's not sea level per se but rather a theoretical "sea level" that a computer generates if Earth were really a smooth ellipsoid. (The dark blues are essentially sea level even though they don't quite correspond to 0 feet on the scale.) With this data superimposed over a recent Google Earth grab we can notice changes in the ice front. Study this one carefully. Can you find areas in the image where recent ice loss has occurred? The data for this image came directly from the wide angle ATM laser.
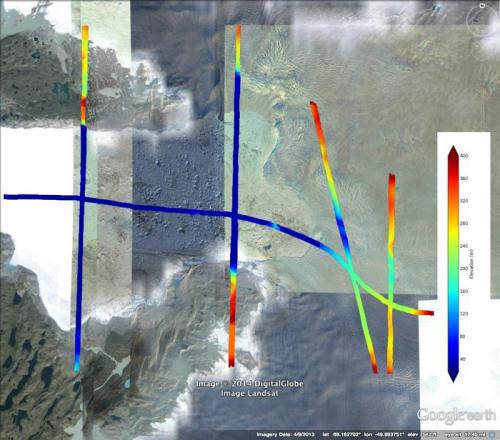 Color rendered elevation map of our flight lines shown on a Google Earth map of Jakobshavn Glacier. The dark blue is sea level while the dark red represents 400 m in elevation. Notable ice loss has occurred since the satellite image was taken on the lower right corner of the ice front. Image courtesy of NASA, Operation Ice Bridge 2014
This final graph is simply an elevation profile of the second vertical colored bar from the left in the picture above. The profile is oriented so south is left and north is on the right. The deep "well" in the middle represents the iceberg covered ocean immediately adjacent to the calving front. One particularly intriguing feature are the "blips" of data in this well. Those are individual icebergs and it their heights can be estimated from the graph - the tallest berg looks to be around 50 m tall (= 165 feet or so)!
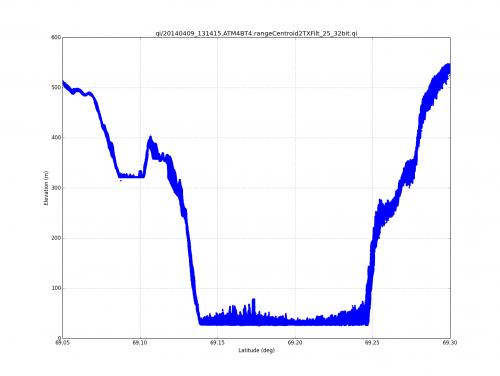 Cross-section profile of a flight just in front of the ice face of Jakobshavn Glacier. _Image courtesy of NASA 2014_
Here are a few photos to show what the ice looked like from the plane. The larger ice bergs are about the size of a city block, to provide a sense of scale.
 Looking across the frozen sea of icebergs in front of Jakobshavn Glacier. The ice front, in the distance, is roughly 100 m tall.
 This photo shows how far inland the crevassing and slumping of Jakobshavn Glacier extends. We are many miles inland looking back west toward the ice front and the crevassing is as prolific as ever. This relatively new activity is the reason the Jakobshavn Glacier data grids had to be expanded in size.
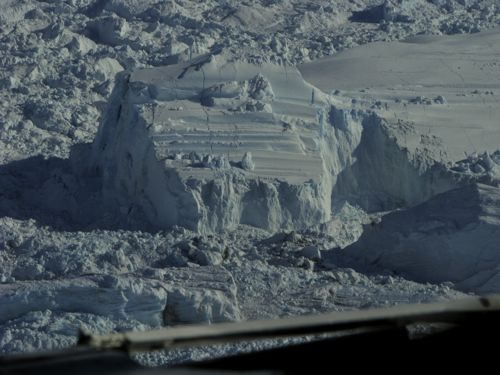 A large berg in front of Jakobshavn Glacier.
Question of the day: How can the height of the plane over the ice be determined using a laser?
Harder question: How would the attitude of the plane (its pitch, roll, or yaw) affect this calculated distance?
Still harder question: How might the scientists account for this problem?


Comments