After a long winter at home, then a month in the Alaskan Arctic, I felt a need for some time with my wife Julie and the tropics. Time for "Polar to Solar" v2.0; Destination, the Big Island of Hawaii. What better way to make up for missed summer than a visit to the beach. To melt some of the permafrost, why not an active volcano! After crossing the arctic circle at 66 degrees north, time to go south of the Tropic of Cancer at 23 degrees .
 After no sunsets in the arctic, Julie helped lower the sun below the horizon for a beautiful sunset over the pacific.
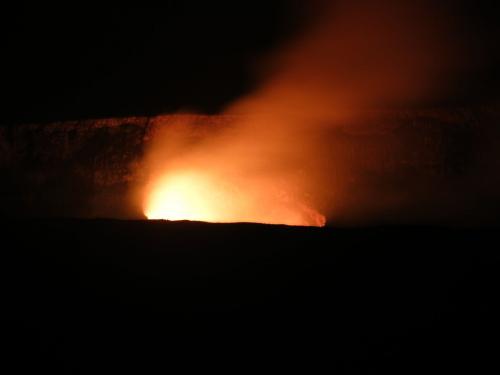
 Kilauea volcano at night.
The Hawaii Volcanos National Park includes the active Kilauea volcano. Though we were not able to see any lava floes, we did see the lava lake from the rim of the caldera at night. Quite a spectacle! It is amazing to think that this entire island was formed by a series of volcanic eruptions originating on the sea floor some 20,000 feet down. If measured from it's base to the 13,800 foot summit, it is taller than Mount Everest. In winter, the summit of this peak is snow covered and if one drills into the cinders on the summit, there is permafrost remaining from the last ice age, 10,000 years ago. This was a surprise to me, thinking I had left the arctic land of permafrost for the tropics. Near the summit of Mauna Kea there is even a small lake. Unfortunately it has pretty much dried up in the last 5 years due to a prolonged drought on Hawaii. I wonder if this is a localized event, or part of a larger change in climate?
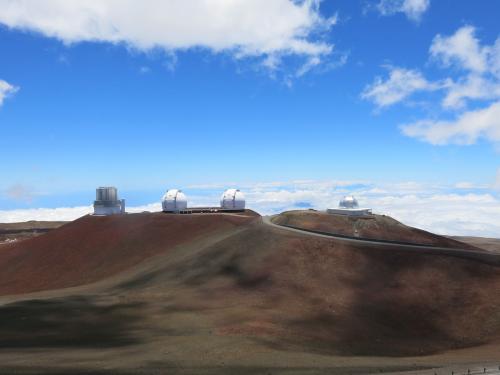
 The Keck Telescope on top of Mauna Kea. The thin atmosphere and little light pollution make this an ideal ocation for astronomy.
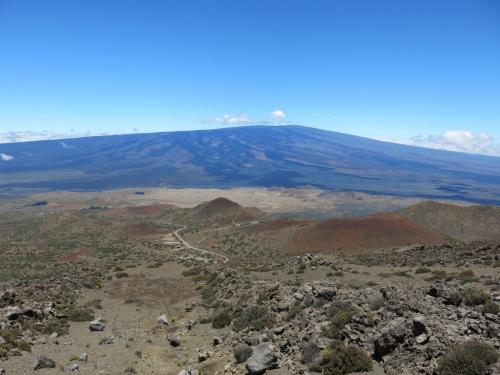
 Mauna Loa seen from the summit of Mauna Kea, 13.800 feet.
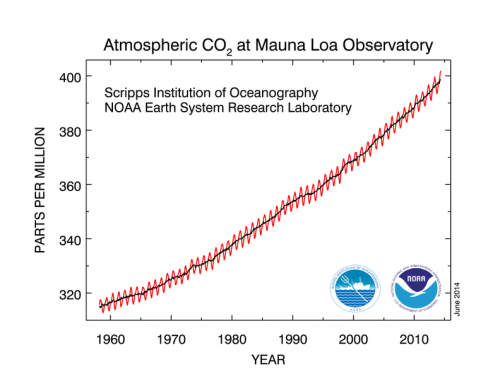
Across the saddle from Mauna Kea is the slightly lower Mauna Loa volcano (13,679 ft). One of Mauna Loa's distinction is the weather station near it's summit. This is essentially ground zero for climate science. Since 1958, atmospheric data including CO2 concentrations in the air have been diligently recorded. This data set has resulted in the ubiquitous "Keeling Curve" named for Charles David Keeling. This is the graph showing the exponential growth of atmospheric carbon dioxide concentration over the last 55 years. Keeling essentially was the guy that first figured out how carbon dioxide fluctuates seasonally, and how it is steadily increasing over time. Keeling's early research took place in California and Arizona. In these mainland locations he had difficulty controlling for industrial CO2 emissions and the local effect of vegetation. The solution: a high elevation location far from cities or forests with good air mixing. Mauna Loa fits the bill, Located at 19 degrees north latitude, and in the middle of the Pacific Ocean far from any land or cities, it is very representative of a global average for atmospheric gasses.
 The Keeling Curve shows the CO2 record from Mauna Loa for the past 55 years. Note the exponential change during this short time span.
If one examines the Keeling curve, there is an annual peak in CO2 levels occurring in November and a low in May. This is explained by the effect of summer time photosynthesis and the consumption of CO2 by plants. The northern hemisphere contains the majority of the earth's land masses, and forests. During the northern summer, these plants are consuming more CO2 than in the northern winter, hence the seasonal fluctuation. The other notable thing in the graph is simply the rate of growth and the increase in slope with more recent dates. Unfortunately there is no indication of a leveling off, only exponential change. On our visit in June 2014, we had the distinction of breathing over 400 parts per million of CO2 in the air. This is the highest concentration of carbon dioxide the earth has experienced since the Pliocene era 3 to 5 million years ago (Scripps 2013). https://scripps.ucsd.edu/programs/keelingcurve/2013/12/03/what-does-400-ppm-look-like/#more-481
 CO2 concentration for the past 400,000 years. Today, at 403 ppm, we have more CO2 in the atmosphere than in the past 3-5 million years.
