The Carbon/Temperature Graph
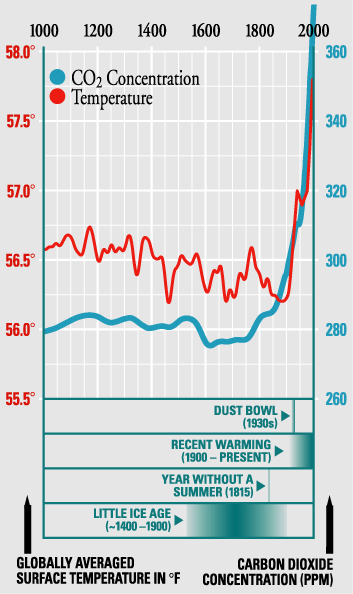
The graph below shows air temperature and amount of carbon dioxide in in the atmosphere over the past thousand years. Examine the graph. What do you notice?
 Temperature/CO2 Graph
You may see that Earth's temperature varies over the past thousand years. Temperatures from the past can be determined using proxy data. A proxy is a stand-in, or a replacement. Since systemized weather records weren't recorded one thousand years ago, we can use evidence from tree rings, fossils, and ice core samples to learn about past environments. Tree rings show how much a tree grew from year to year, indicating whether or not the tree had enough water and nutrients to grow. Fossils give evidence about what plants and animals were found in an area. Ice core samples contain air bubbles, preserving the amount of oxygen, carbon, and dust (from volcanoes) found in the atmosphere at the time that snow fell. This snow and its components are captured in glacial ice. Scientists drill into the ice and extract core samples (these look like tubes of ice) to study. Students can model how scientists use proxy data to learn about past environments.
 Students Examine an Ice Core Model
The graph shows that, despite ice ages, Earth's temperature falls around a baseline for most of the past thousand years. Since the 1800's, Earth's temperature has been on the rise. The increase is happening at a faster rate than seen before, and is reaching temperatures higher than values seen in the past thousand years.
Rise in temperature correlates to rise in carbon dioxide (CO2) in the atmosphere. Notice that this rise in CO2 began in the 1800s, the rise of the industrial age. As of May, 2014, the level of atmospheric carbon is at 401.88 ppm (parts per million). The annual rate of increase in CO2 is more than doubled the increase since the 1960s. CO2 level
Why is this rate increasing so dramatically? What are the consequences of the rises in temperature and CO2? What can be done to reduce the rates of increase? What changes in our environment should we anticipate, and how can we prepare for these changes?
Researchers at Toolik Field Station are working to answer these questions, and more.

