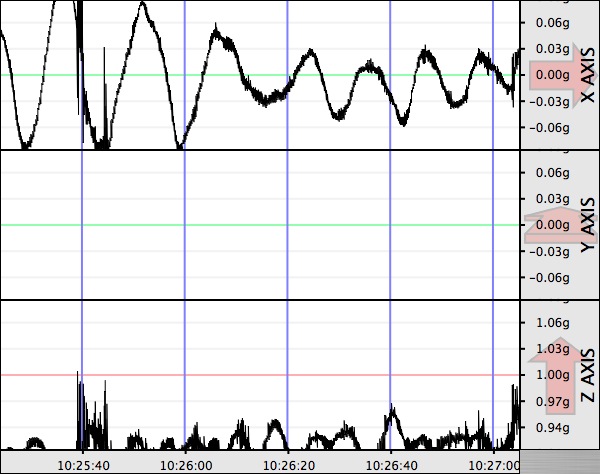
The Healy encountered rough conditions once we left Dutch Harbor. The wind speed exceeded 35 knots, the wave swells reached 10 feet, the temperatures were in the low teens, visability was approxiamately 1 mile and. I took the measurement (below) with Seismac, a MacOSX utility, that turns your Mac into a 3-axis seismograph. The readout illustrates the motion of the Healy on the Bering Sea at 10:25am on March 14, 2008. This was after it settled down enough to feel confidant to have my laptop out! Otherwise, everything had to be secured or on the floors. Needless to say, walking through the corridors was an interesting adventure in itself, but the Coasties said that it was nothing compared to the seas in the Gulf of Alaska.
Seismac graph
 Seismac graph
Seismac, a MacOSX utility, turns your Mac into a 3-axis seismograph. This readout illustrates the motion of the Bering Sea at 10:25am on March 14, 2008. We saw the first sea ice at 11:07am. There was a buzz on the bridge amongst the Healy crew and science crew. The ice was starboard off in the distance, close to 1000m. We arrived at the sea ice around noon. Once in the sea ice, the snow cover slowed us. Snow creates friction on the sides of the ship and creates a snowplow effect on the bow. The bow is designed to ride up on the ice and push it to the sides. However, snow piles up in front and in areas with numerous ice ridges, it becomes problematic. The ship is forced to stop and ‘ram it' several times or maneuver around it.
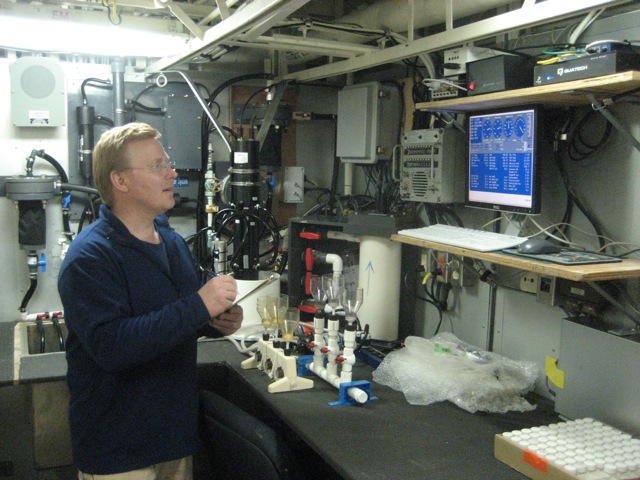
Since leaving Dutch Harbor, there are several projects that are underway. Scott Hiller of the Scripts Institute of Oceanography in San   Diego, monitors and maintains the Under Water Science System. The system utilizes the latest technology for measuring the physical properties of the seawater. In addition, Mr. Hiller is evaluating the effectiveness of a couple new sensors for possible future inclusion in the system in next year.

**Taking measurements**
 Taking measurements
Mr. Kasemodel taking measurements at the Sea Water System. The system ensures that all scientists have access to uncontaminated surface seawater and provides the science party with the seawater chemistry and weather data necessary for their studies. The system is useful for calibrating other data collection equipment.
The weather sensors are located throughout the ship, however, research has shown the bow of the ship to be the most effective location for collecting weather data. Air temperature, dew point, humidity, atmospheric pressure, wind speed, wind direction, short wave and long wave radiation are just some of the variables that are collected with the weather sensors.

PAR, or photoactive radiation, measures the intensity of light. It can distinguish between the short wave radiation or direct sunlight and the long wave radiation or reflected light, which is useful in determining the albedo. The light intensity is important since it affects organism's activity.

The seawater variables measured include surface water temperatures, oxygen levels, chlorophyll-a, and salinity. The flurometer measures the chlorophyll-a levels giving an indication of the amount of algae there is in the water and ice. Levels are relatively low at the moment since we are in the winter. Once the ice begins to melt in the springtime, the levels will go up with the algae bloom. The thermosalinograph measures the conductivity of the sea water surface. By raising the water temperatures to a precise known amount (21 degrees C), the salinity can be calculated. Salinity is a measurement that is dependent on the conductivity and temperature of the water.

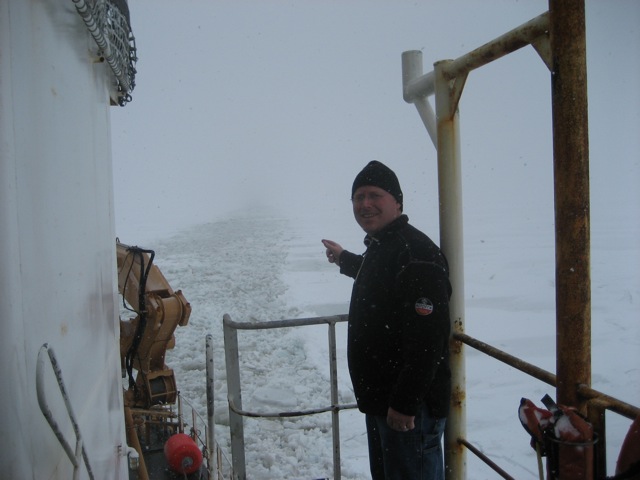
**Checking out our path**
 Checking out our path
Mr. Kasemodel on the 02 Deck of the Healy on Friday March 14, 2008.

