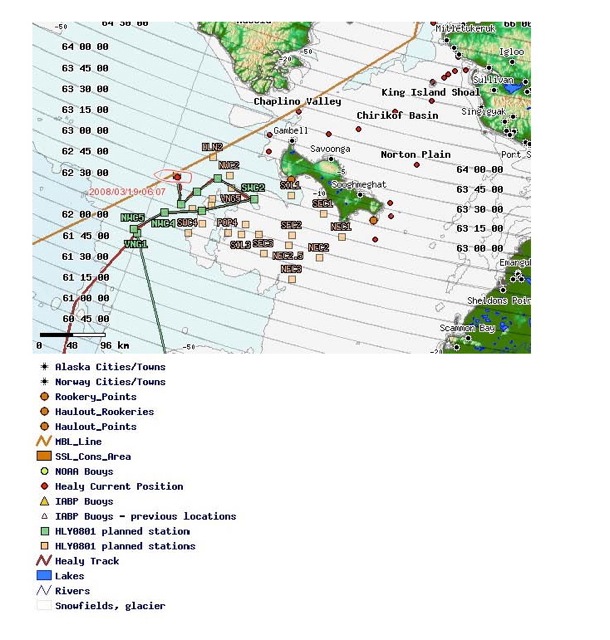
The Healy was near sampling station, DLN3, when the opportunity presented itself to the sample the snow and ice on the ice pack. DLN3 is approximately 3 miles from the International Dateline. It was interesting to have yesterday feel like tomorrow! **
Next to the Dateline!**
 Next to the Dateline!
The Healy was within 3 miles of the International Dateline southwest of St. Lawrence Island in the Bering Sea. Rolf Gradinger led a team of scientists down the gangway to the ice. Dr. Gradinger is studying the role of sea ice algae as a major food source for herbivorous plankton and benthic organisms in the eastern Bering Sea. The goals of his research are to calculate the biomass, diversity, production, and fate of ice algae in the study area south of St. Lawrence Island. Several field measurements and experiments are used to accomplish this task. Primary chemical measurements are nutrients and salinity levels. Primary physical measurements include ice thickness, snow depth, ice temperatures, and light levels. Other measurements include algae variables such as describing the species, the species composition, and their size.
**Dressed up and ready to go**
 Dressed up and ready to go
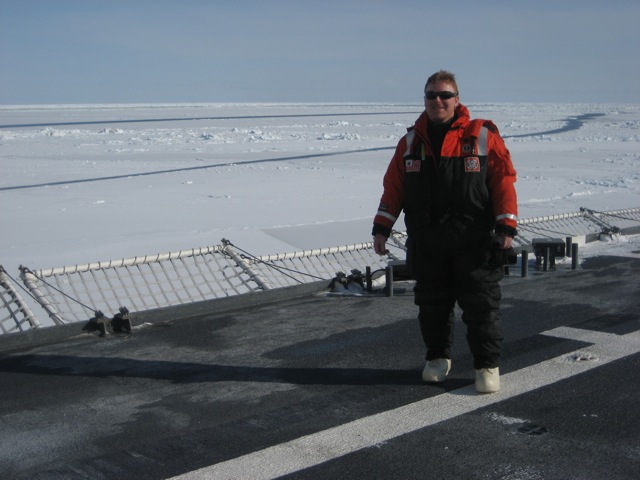
Mr. Kasemodel on the flight deck of the Healy in the Bering Sea south of St. Lawrence Island. **
Preparing the gangway**:
 Preparing the gangway
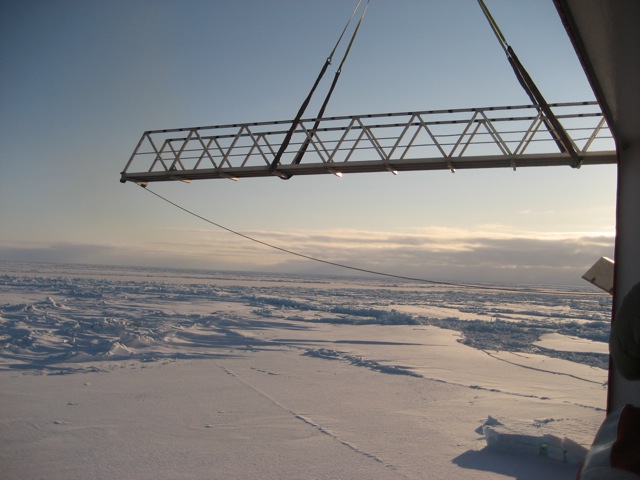
The sea ice near St. Lawrence Island in the Bering Sea. Sampling sites are selected by covering the typical ice condition range observed for that station in terms of floe size, snow depth and ice thickness based on the standard ice observations.
On the ice!
 On the ice!
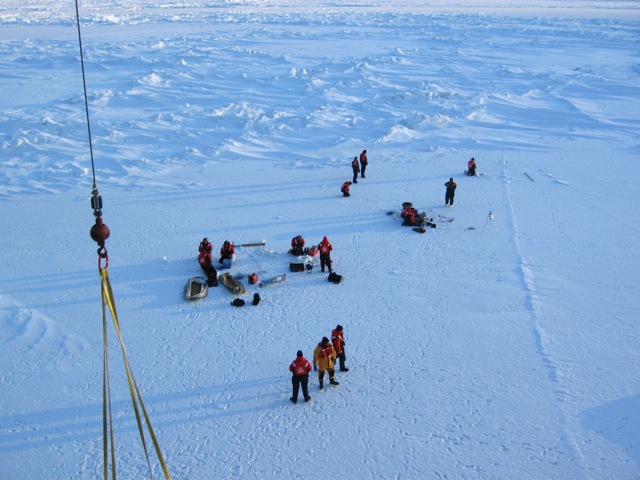
Taking snow, ice, and light measurements on the sea ice near St. Lawrence Island in the Bering Sea. Photo courtesy of Clarence Pautzke, North Pacific Research Board. By drilling into the ice and taking core samples, he can measure the variables away from the influence of the ship. Everyone on the sampling team has a role in taking the measurements. The Coast Guard had bear watch personnel, dive personnel, and equipment assistants on the ice as well.
**Preparing an ice core**
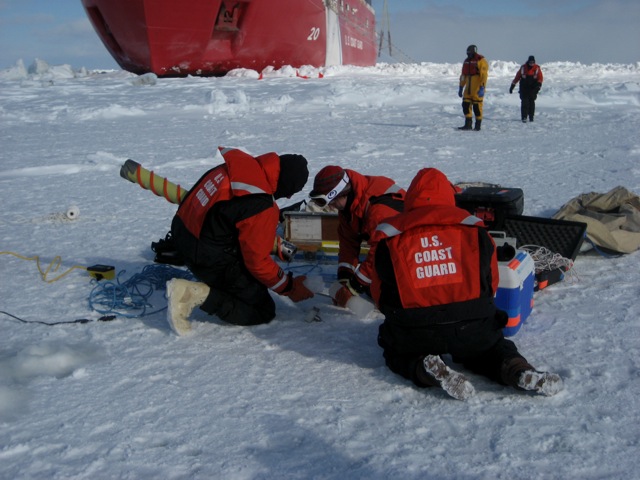 Preparing an ice core
Ice core measurements on the sea ice near St. Lawrence Island. Sampling on the ice is conducted with ice corers, water samplers and a portable CTD (measures conductivity, temperature, and depth). Temperature, salinity, light and chlorophyll fluorescence of the upper water column (upper 30m) are determined with a SEACAT 19plus CTD lowered by hand through an auger hole in the ice.
levels of algae in the sea ice. Snow and ice depth are measured with specialized rulers.
**Measuring the light penetration through the sea ice**
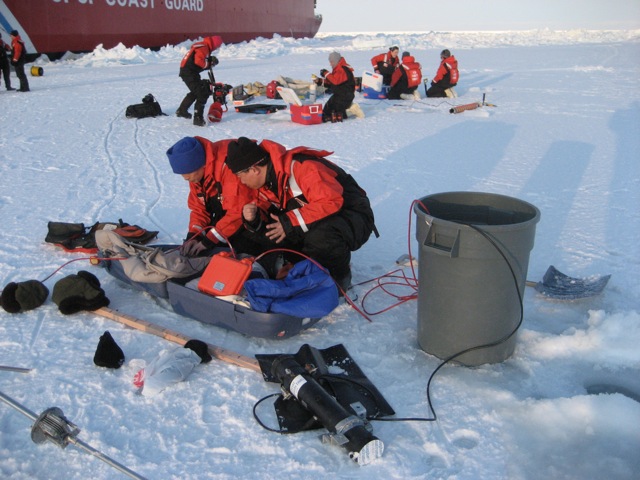 Measuring the light penetration through the sea ice
Measuring the light penetration through the sea ices near St. Lawrence Island in the Bering Sea. I was able to assist in yesterday's and measurements on the sea ice. It is a great feeling to be out on the ice and to look up at the ship from the sea ice. The sampling was done in the evening as the sun was going down. The light was incredible! I measured the snow depths on the ice floe. The snow depths are an important component of algae production, since deeper snow lessons the amount of available light that is able to penetrate the ice.
**Collecting snow**
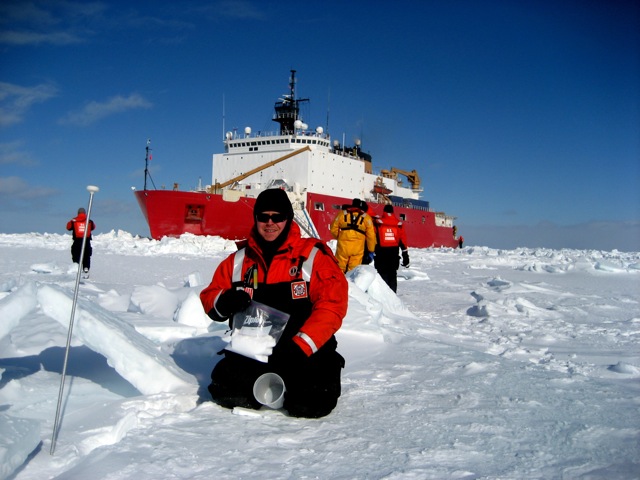 Collecting snow
Mr. Kasemodel collecting snow for density measurements back on the Healy. Knowing the productivity of the algae is important since it forms the basis of the entire ecosystem in the northern Bering Sea. It is the driving force in the food web. Zooplankton feed upon it, Arctic cod feed upon the zooplankton, and seals feed upon the cod. The majority of the algae dies and falls to the sea floor. On the sea floor, the benthic organisms, such as clams, mollusks, and sea worms, consume it. The bearded seals, walruses, and spectacled eiders feed on the benthic organisms. If the sea ice is reduced dramatically, the entire ecosystem will be disrupted through food web mechanisms or sea ice habitat for the apex predators.
**Changes in the Bering Sea**
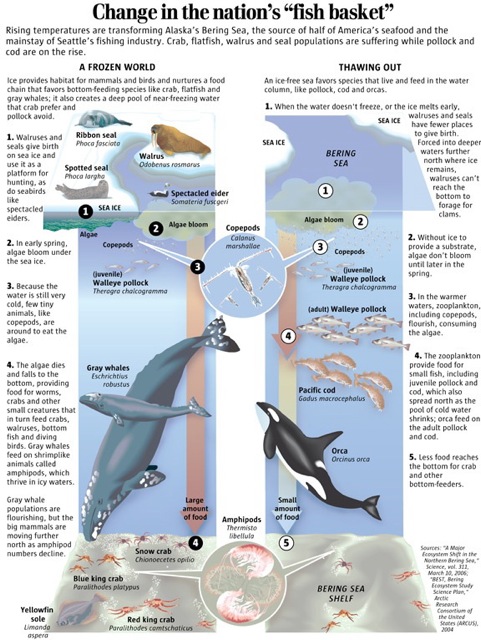 Changes in the Bering Sea
The Bering Sea ecosystem, image courtesy of The Seattle Times.
The receding ice pack
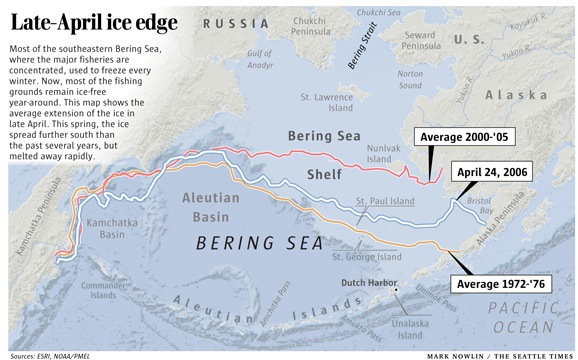 The receding ice pack
Diagram, courtesy of The Seattle Times, illustrating the receding ice pack over the past 30 years.

