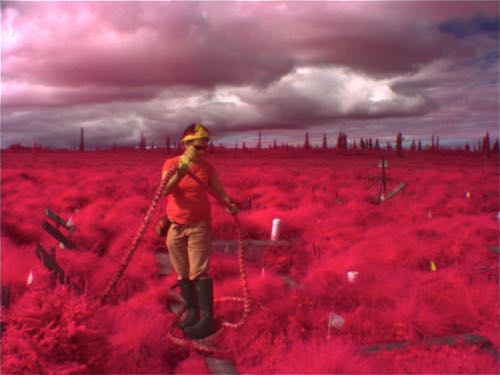
 Karen Temple Beamish looks good in RED!
Refresher on Light Energy
Visible light energy emitted from the sun is absorbed by the chlorophyll in green plants to be used in photosynthesis. Alternatively, a plant's cell structure reflects the near-infrared part of the energy spectrum. Plants with more leaves both absorb and reflect more of these wavelengths of energy.
Earth Observatory
Launched over 30 years ago, NASA's Earth Observatory Satellites (EOS) measure and map the density of green vegetation over the surface of the earth. Scientists use this data to help them understand environmental change like droughts, deforestation and climate change. NASA's satellites collect data on the amount of energy absorbed and reflected by the earth's surface and translate this into the amount and health of green plants that occupy the earth.
NDVI
Normalized Difference Vegetation Index or NDVI is a simple equation that is used to estimate the density of green plants on a landscape, using the near-infrared and visible light data that is collected by the satellites. If the NDVI value is closer to 1, than the landscape is covered with a lot of vegetation, like a tropical rainforest, photosynthesizing and absorbing alot of carbon dioxide. If the NDVI value is closer to 0, then the landscape lacks vegetation, like a desert with a low productivity and therefore less capable of absorbing less CO2.
CiPEHR uses NDVI as another measure of how well the tundra absorbs CO2 from the atmosphere. The CiPEHR team measures NDVI using a handheld device that looks a little like a camera, a camera that measures how much infrared energy is reflected and how much visible light is absorbed by the tundra's mosses, shrubs and lichen.
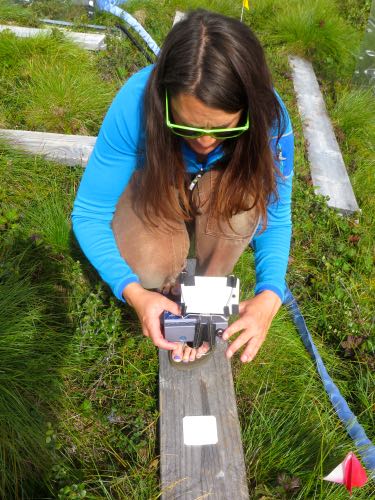
To collect her NDVI data, Meghan Taylor must first point her "camera" at a white swatch to normalize the data to account for differences in light availability resulting from cloud cover changes.
 Meghan measuring NDVI
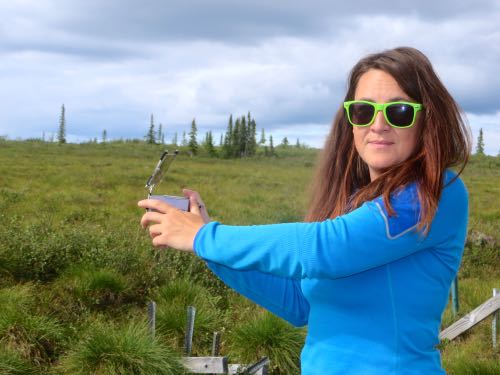
Meghan then points her "camera" at the plot.
 Meghan Taylor measuring NDVI
The images are then uploaded to the computer, where Meghan uses a software program to process the data to arrive at an NDVI value for each plot. Data is collected once each week during the growing season, late April to early May.
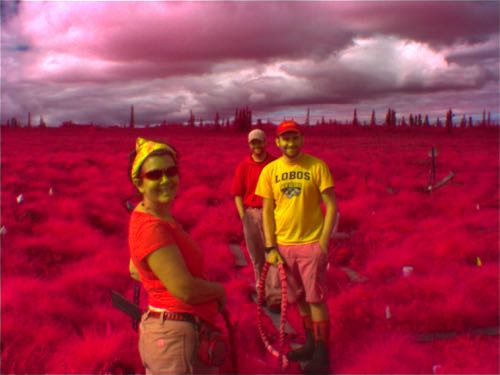
 Research Crew all in RED!
You can see that Karen and the Crew reflect near infrared pretty well!
Notice Michael's T-shirt? Michael Duric lived in New Mexico as a child, and returns as often as he can. He loves NM and GREEN CHILI. Good thing I brought a supply up with me to the cabin. We have made green chili corn bread and added the green chili to stews. Michael was super excited. GO LOBOS!
To learn more about how NDVI works visit NASA's website;http://earthobservatory.nasa.gov/Features/MeasuringVegetation/measuring_vegetation_1.php


Comments