First News
We had some visitors early this morning but they did not come aboard. The USCGC Healy was spied as the sun was rising way off in the eastern horizon. The Healy is an icebreaker from the United States and worked with the Louis S. St Laurent for three years, 2008-2010, on the Extended Continental Shelf Survey a series of seafloor mapping efforts. This survey discovered the Savaqatigiik Seamount at 81˚ 32’16N and 134˚ 33’48W on August 25, 2009 and a plaque on the Louis commemorates the occasion. Gina Nicoloff (DFO-IOS) got a couple of nice photos of the sunrise and the Healy.
We are headed towards Mooring Station A for the redeployment and are planning a couple of extra fill in CTD rosette stations since we seem to be doing well time-wise which all could change if the weather makes the mooring work difficult. Time will tell on that front. Fill in CTD rosette stations are places on the map that have not been sampled before and usually lie off the routine grid. Those data can be helpful in filling in spots where there are questions that have not been resolved. Hey… since we are here we may as well do them!
Crew Member Focus
Dylan Mehaney is an Oiler/Engine Room Assistant on the CCGS Louis S. St. Laurent. He told me that "Oiler" is the old term for his job, really not used much outside the Coast Guard. Dylan grew up in the small village of Indian Cove, Newfoundland, population 75. Indian Cove is one of 36 small communities on New World Island whose total population is about 3500. There is one K-12 school on the island and Dylan graduated as one of 32 students in his high school senior class. He currently owns a house and lives in Twillingate, Newfoundland, but says he would love to get back to Indian Cove some day. Dylan did a one-year Marine Diesel Mechanics program at the Marine Institute in Newfoundland. He then worked for a couple of years on various cargo ships then got his current job with the Coast Guard two years ago. His goal is to get a 4th Class Marine Engineering Certificate (the equivalent of a Journeyman Mechanic) which would allow him to move up to the Engineer on Watch. Dylan says when something goes wrong (as it does) the teamwork involved in solving and fixing it is the most rewarding aspect of his job. When at home during his time off (4 to 6 weeks) he plays and writes music, with his main instruments being the piano and guitar, and does lots of hiking and exploring with his spouse. Dylan says that lots of people in rural communities in Newfoundland work turn-around jobs like him. He thinks that is helping to revitalize those rural communities because people are moving back even if it means only living there when not deployed.
Sea ice thickness in the Beaufort Gyre region
While our knowledge of the Arctic system is improving, there are many gaps in our understanding of how this complex system works. These gaps result in substantial uncertainty in predictions of Arctic sea ice. One of the most striking observations in recent years has been a reduction in sea-ice volume (Figure 6), with the most pronounced loss in the Western Arctic Ocean ( Figure 7). These changes have been explained in part by unusual atmospheric conditions resulting in major losses via enhanced ice transport in 2007. Figure 7 illustrates this comparing relatively normal sea ice drift and extent conditions of 2001 with anomalous conditions in 2007. Note that the area of open water increases with ice loss, resulting in large positive anomalies in solar heat input to the upper ocean initiating additional ice melt and delaying freezing the following fall.
One of the important parts of the Beaufort Gyre Observing System (BGOS) is focused on the measurements of sea ice draft (thickness of sea ice under sea surface). The Upward-Looking Sonar (ULS) systems determine the return travel time of an acoustic pulse reflected from the sea ice or water surface. A pressure sensor is incorporated to measure the sea level changes due to winds and tides, and the vertical changes in the mooring length due to current drag. Ice thickness is computed from the difference between the instrument depth and the range to the underside of the sea ice. The range is corrected for instrument tilt and speed of sound differences (which may be estimated from the uppermost MMP data and open water events). Sea-ice concentration and thickness are needed to estimate freshwater content in sea ice and seasonal component changes of the Beaufort Gyre freshwater balance.
Most importantly, in situ sea ice thickness measurements are scarce. Sea ice thickness data from BGOS moorings has been extensively used for validation of satellite products and for validation and recalibration of Arctic Ocean Model Intercomparison Project (AOMIP) models. It is also important that the measurements obtained in the Beaufort Gyre region are representative of the entire Arctic. For instance, how well does the sea ice thickness and concentration measured by the BGOS moorings mirror sea ice thickness and concentration over the entire Arctic? We have found that the fraction of open water observed at all mooring sites correlates well with total ice extent in the Arctic. This is not surprising because the maximum reduction of sea ice extent and volume were detected in the Canadian sector of the Arctic Ocean.
The seasonal variability of sea ice thickness is very well pronounced in the Beaufort Gyre region with thickness increase in winter and ice melt (thickness decrease) in summer. Seasonally, the change of sea ice thickness is approximately 2 meters (Figure 9, top panel).
We found that the sea ice thickness reduction in the Beaufort Gyre region is approximately 5 cm per year ( Figure 9) and that since 2003, the melting ice contributed approximately 500 cubic kilometers of fresh water to the Beaufort Gyre freshwater reservoir.
From our 2017 BGOS expedition and from observations which Healy does now in parallel with us (see “T” sites in Figure 9, bottom panel) we will have an excellent 1-year data time series for the entire Beaufort Gyre region from nine ULS instruments.
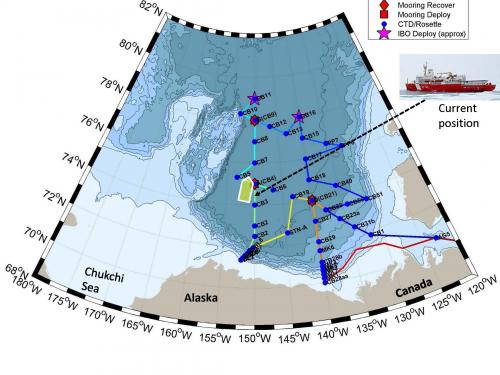 Our location.
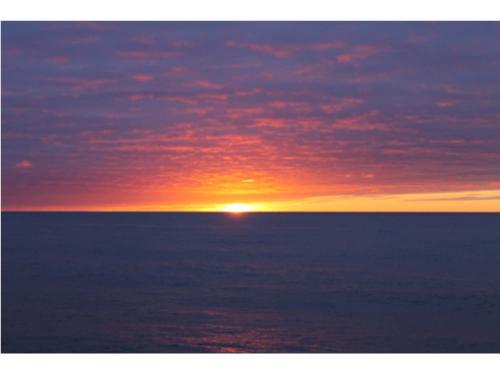 Arctic Sunrise. An Arctic sunrise taken from the CCGS Louis S. St. Laurent. Photo by Gina Nicoloff.
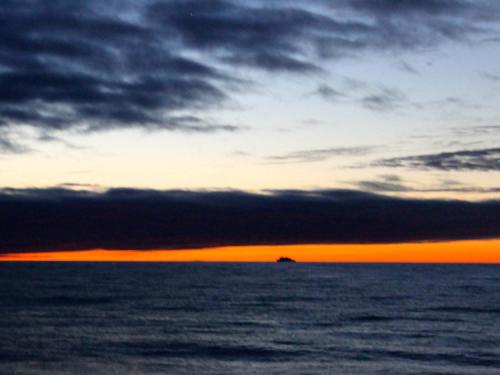 Healy on the Horizon. USCGC Healy on the horizon of an Arctic sunrise. Photo by Gina Nicoloff.
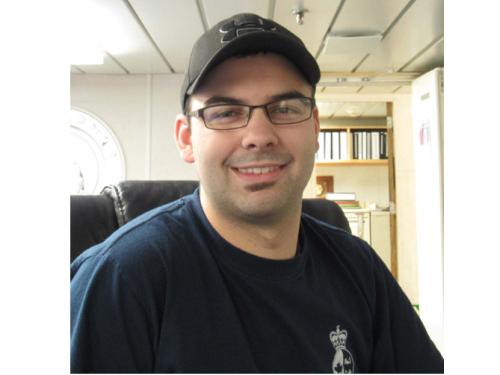 Dylan Mehaney. Dylan Mehaney, Oiler on the Louis S. St. Laurent. Photo by David Jones.
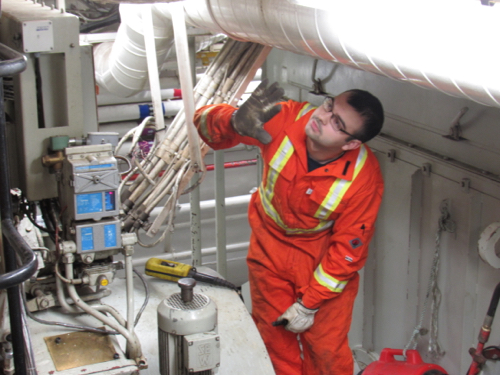 Dylan Signals. Dylan Mehaney, Oiler on the Louis S. St. Laurent signals that they are positioned to work on cylinder #5 on one of the 16-cylinder turbo diesel generators. Photo by David Jones.
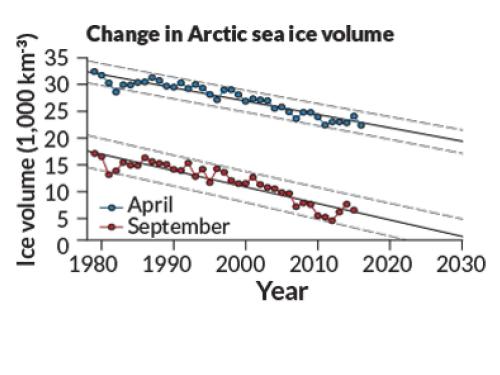 Figure 6: Monthly average Arctic sea-ice volume for April and September. Linear fits suggest sea-ice volume at the end of Arctic summer is decreasing by 320 km3 per year. Graph is from Desch et al., 2017 and the data are from PIOMAS model (http://psc.apl.uw.edu/research/projects/arctic-sea-ice-volume-anomaly).
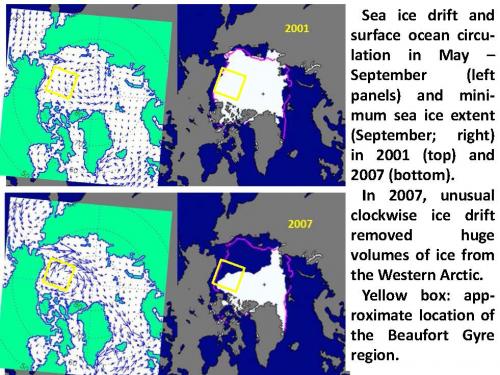 Figure 7: Schematics explaining sea ice extent anomaly observed in 2007. See text for details. Prepared by A. Proshutinsky.
 Figure 8: Upward-Looking Sonar (ULS). Upward looking sonar IPS4, manufactured by ASL Environmental Sciences, is mounted in the uppermost mooring flotation to sample the ice draft with a precision of +/- 0.05m in ice thickness after data processing. Courtesy of Rick Krishfield.
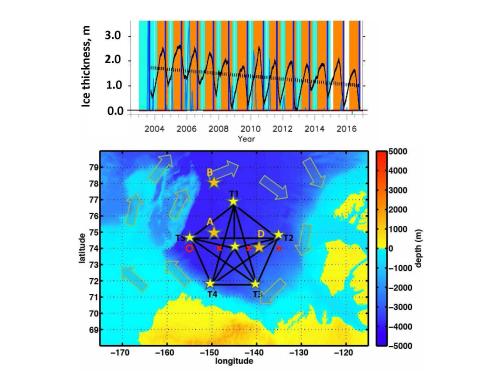 Figure 9: Upper panel shows sea ice thickness changes observed in 2003-2016 by BGOS ULSs instruments. Bottom panel shows locations of BGOS ULS instruments (large stars “A”, “B” and “D”). Additional instruments (ULSs, BPR and ADCPs) were deployed in 2016 at “T” sites by US Coast Guard Icebreaker Healy and will be deployed soon by Healy working in parallel with us. Prepared by A. Proshutinsky.

Comments
Add new comment