First News
After the successful redeployment of Mooring Station A, last night we steamed to the east and found ourselves at Mooring Station D aka CB21. This is the last of the mooring stations and will involve two days of work. Today is all about recovery, then we will do a little triangle overnight hitting a couple of CTD rosette stations (CB27 and CB22) then wind up back at Mooring Station D at daybreak for redeployment. By the way, CB22 was already done earlier in the cruise. Because we are here, the decision was made to do the CTD rosette at the station again. Not because the first try was a failure but because in oceanography, the chance to sample a station twice in one cruise comes rarely and the data collected can provide important information about ocean changes at tens of days temporal scale. This also can be helpful in understanding what sorts of error is being made in the routine CTD rosette measurements.
On this cruise, it's the mooring stations that are the really exciting part of the science being done. Everything is painted bright yellow, there are cables and chains and shackles, there is all kinds of really expensive instruments, there are men wearing hard hats and safety harnesses operating cranes and winches and the ship is held in position for hours at a time. The mooring work gets a lot of attention. The CTD Rosette sampling is much more humdrum, routine and not-so-flashy. The rosette has 24 grey colored Niskin bottles mounted on it, and there is a single winch that lowers the CTD rosette into the water, and then raises it back up. The CTD rosette is rolled out of its shed, then once it has made its trip to the seafloor it is rolled back in the shed and samples from the Niskin bottles are taken. The samples are either stored for analysis later or analyzed onboard in some small room in the bowels of the ship. CTD rosette casts are done at least once but often multiple times a day, rain, snow, wind, day or night.
But, it is the CTD Rosette part of the JOIS cruise that kind of acts like the backbone of the operation. For each cast there are 15 different analyses done supporting 5 major lines of research. Each cast has 24 Niskin bottles, so there are roughly 350 samples taken for each cast. In a single JOIS cruise, there are 60-70 casts done making for somewhere around 20,000 samples that are taken. And that is just the rosette work. The CTD portion of each cast adds thousands of data points for Conductivity, Temperature, and Depth at each station. This is not to minimize the importance of the data that comes from the mooring stations because those data represent an entire year of data in a single position. On the other hand, the CTD rosette program is a single data set for a single point completed over a month time period but covering a much larger area of the Beaufort Sea.
Beaufort Gyre Observing system: water circulation
Ocean currents are directly measured at BGOS mooring sites by McLane Moored Profilers (MMPs, Figure 12) and upward-looking Acoustic Doppler Current Profilers (ADCPs) to document changes in Beaufort Gyre (BG) kinetic energy (in the center of Beaufort Gyre at mooring D, and at its periphery at moorings A and B). They are also used to characterize changes in the flow field that occur in conjunction with sea-ice conditions and atmospheric circulation changes. The MMPs are typically programmed to perform a pair of one-way profiles between ~50 m and ~2050 m every other day, with each profile in a pair separated by ~6 hours. The ADCPs sample hourly.
The first interesting and important results were obtained by analyzing tidal ocean parameters and energetic mesoscale (intermediate in size) eddies at all depths in the water column. At mooring B a particularly energetic eddy field is routinely observed probably because of its close location to the continental slope currents (Figure 13). Eddy water mass properties allow us to infer eddy origins, pathways and formation mechanisms in mooring B. Deep energetic eddies at mooring B appear to be associated with a formation mechanism that results from inter-basin exchanges. The circulation and eddy studies suggest that much of the inter-basin exchange in the BG, due to inflows and outflows over and through topography, take place through mesoscale eddy transport. Mooring B is an important site for measuring the energetics and dynamics in the boundary regions of the BG. We are still working with other moored ocean current data including those from the upward-looking ADCPs.
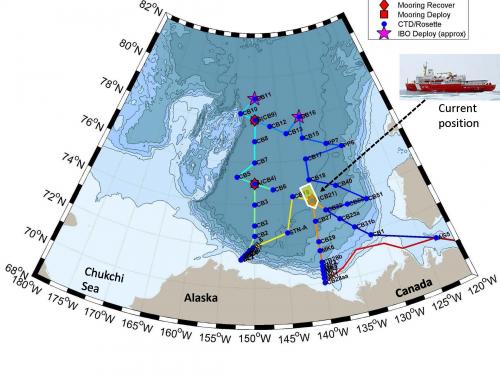 Our location.
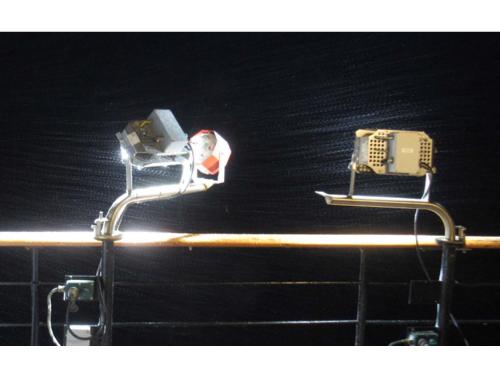 Wind driven snow in the deck lights during a CTD rosette cast. (Photo by David Jones).
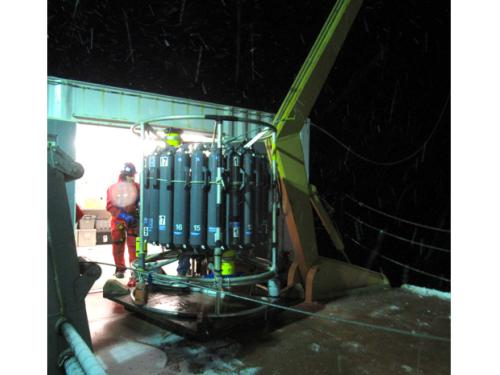 Glenn Cooper DFO-IOS rolls the CTD rosette on deck for a night time cast. (Photo by David Jones).
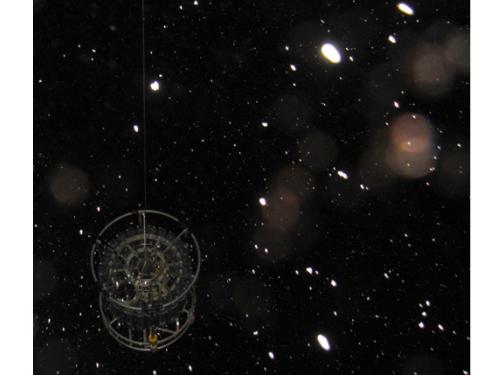 The CTD rosette being lowered in the darkness during a snow flurry. (Photo by David Jones).
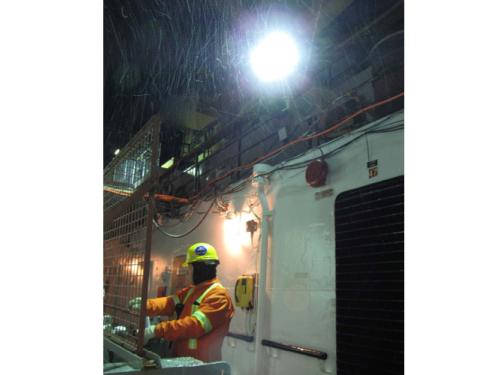 Dave Pike, Quartermaster on the CCGS Louis S. St. Laurent operates the winch during a snowy nighttime CTD rosette cast. (Photo by David Jones).
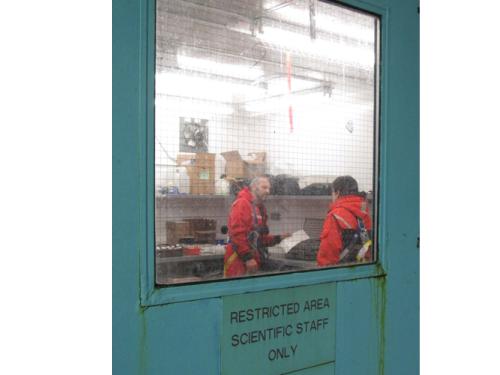 Glenn Cooper (DFO-IOS) and Celine Gueguen (Trent University) work on labeling sample bottles during a nighttime CTD rosette cast. (Photo by David Jones).
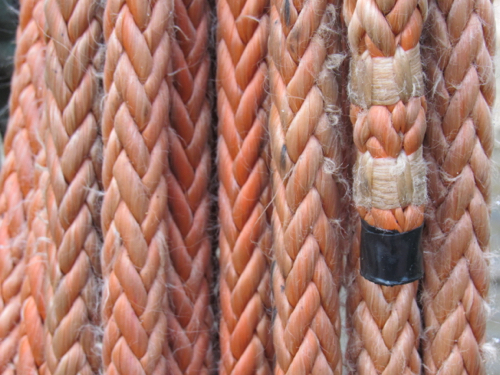 A mystery substance found on the deck of the CCGS Louis S. St. Laurent. What is it?? (Photo by David Jones).
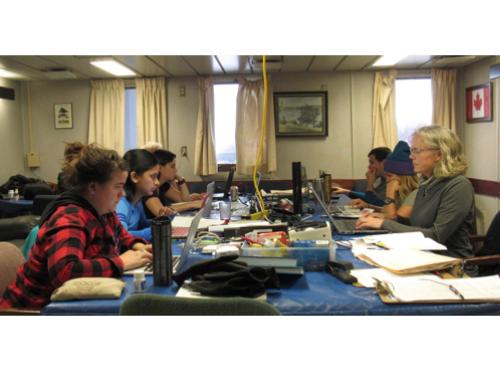 The CTD Crew works on entering and processing data for the CTD Rosette program of JOIS 2017. (Photo by David Jones).
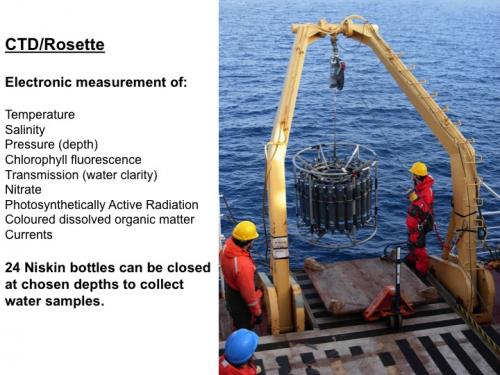 The JOIS 2017 CTD Rosette Program Overview. (Courtesy of Bill Williams DFO-IOS).
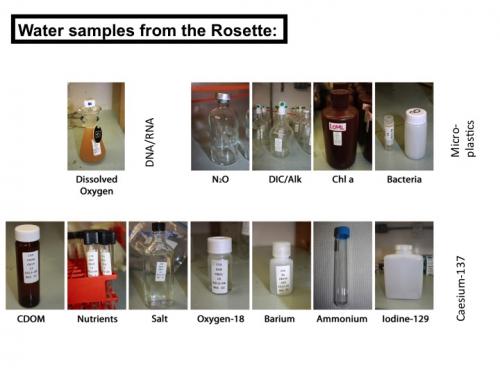 Samples taken from the Rosette (Courtesy of Bill Williams DFO-IOS).
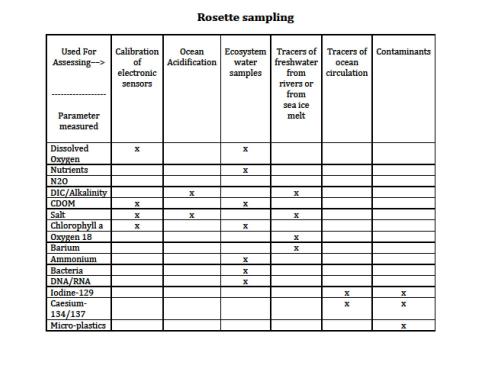 Rosette Sampling Matrix (by Dave Jones).
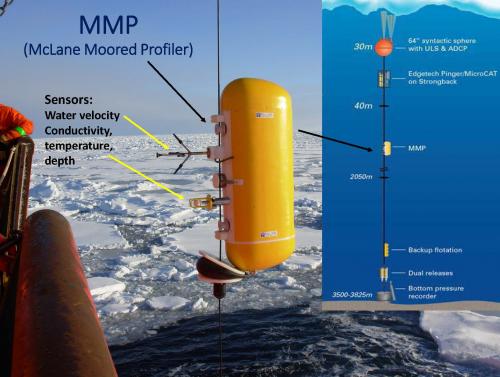 Figure 12: McLane Moored Profiler (MMP) and mooring diagram showing locations of different instruments. MMPs traverse the mooring tether acquiring profiles of water temperature, salinity and velocity between 40-50 and ~2050 m every other day, with each profile in a pair separated by ~6 hours. By A. Proshutinsky and R. Krishfield.
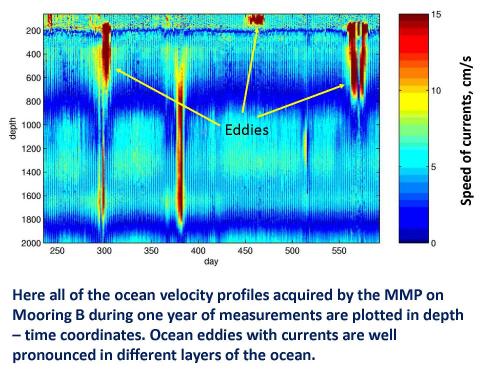 Figure 13: Ocean velocity profiles acquired by the MMP on Mooring B during one year of measurements. Increased currents (ocean eddies) are observed frequently at all depths. By A. Proshutinsky and R. Krishfield.

Add new comment