First News
Last night's out-and back trip towards the northwest took us to a couple CTD rosette stations, CB6 and later CB19 on the return. So we are back at Mooring Station D, aka CB21, for a second try at a mooring re-deployment. Winds have dropped and seas have calmed but the skills of the Bosun, crane and winch operators and mooring technician will be tested.
While at one of the CTD rosette stations last night the annual ritualistic lowering of the Stryo-foam cups into the abyss was conducted by the night shift and lead by Sarah Zimmerman (DFO-IOS). All 150+ cups, including 85 from Ms. McDonald's classes at Saint James Regional High School in Portauxeasque, Newfoundland, were submerged to 1000+ meters and returned to the surface... and not a single one was missing! See photos for results!
Speaking of the CTD rosette, another important analysis that is done is called CDOM an acronym for Colored Dissolved Organic Matter. It measures the amount of colored matter that is organic (versus inorganic) coming from things like leaves, sticks, algae etc. Most of this matter comes in a variety of colors and absorbs light in a variety of wavelengths. Since each compound type absorbs light in a specific region of the light spectrum it is fairly easy to use that signature absorption to identify which organic compound is present in a sample and which is not. Some organic molecules also reemit light in a process called fluorescence that can also be measured and used to identify the type of compound present.
Once the types of organic compounds and amounts are measured, this data can be used in a variety of ways. One of the most common uses is to track the circulation of fresh water in the Beaufort Gyre. Since most CDOM has its origin in river water and river water has signature organic compounds in it then it can be differentiated from fresh water from sea ice melt. Another use is to determine what proportion of Beaufort Gyre fresh water comes from river sources versus the portion from sea ice melt. Yet another is to help determine which rivers (since there are several major rivers that flow into the Beaufort Sea) contribute to the Beaufort Gyre and which do not. Again each river has specific types of organic compounds and there are signature CDOM absorptions for each river making it possible to identify the source river of the fresh water.
Crew Member Focus
Gary Morgan is the ship’s Carpenter. I never would have thought that the ship would have a carpenter. But it does and Gary is it. To my mind, Gary has the best job on the ship. He gets to work in a fully outfitted woodshop building cabinets, furniture and doing all sorts of woodworking projects to keep the ships interior safe, functional, and pleasing to the eye. When not making little sticks out of big sticks, Gary works on deck assisting with moorings operations or Ice Moored Buoy deployments. And he always has one of his cameras with him. Gary's other job (unofficial) is being the ship's photographer. Gary said he started taking pictures with a point-and-shoot camera and putting them on the ship's computer so that the crew members who mainly work inside the ship (engine room, galley) could see some of what was happening outside. Then he got some nicer equipment and discovered he had a knack for getting good shots and the rest is history. One of Gary's photos of the Louis S. St. Laurent was chosen by the Canadian Postal Service aka "Canada Post" for a stamp commemorating the Canadian Coast Guard's 50th Anniversary. Gary has been with the Coast Guard for 22 years and is the only crewmember I met who makes his home in Nova Scotia rather than Newfoundland.
Question from students: What is the major cause of circulation regimes alternation?
Answer: 1997-2016 (continuation)
Following our hypothesis described yesterday (September 26), the prevailing anti-cyclonic regime should have switched to a cyclonic in the early 2000s. Instead, the Arctic has been characterized by an anti-cyclonic regime since 1997 at least until 2016. Results of the Beaufort Gyre Observing System in 2016 indicate anomalously high freshwater accumulation (6400km3) in the Beaufort Gyre region since the start of the present anti-cyclonic regime in 1997. At the same time, the NA (North Atlantic) show a warming of the deep layers in the 2000s that has been attributed to a cessation of deep convection in the region – conditions that typically develop during a cyclonic regime when freshwater is released from the Arctic Ocean. Following our conceptual model, one would expect enhanced deep convection and cyclone formation over the NA (enabled by reduced freshwater fluxes from the Arctic) would have resulted in a regime shift from anti-cyclonic to CCR cyclonic a decade ago due to freshwater release from the Arctic Ocean. However, analyses of freshwater fluxes through Fram Strait purport that the Fram Strait annual mean freshwater flux does not show any large variations since 2002.
We hypothesize that there is at least one additional factor, neglected in our formalism discussed yesterday, which has been influencing NA conditions and has disrupted the auto-oscillatory decadal arctic climate variability. The discussed yesterday Arctic Ocean–NA system without Greenland influence was viewed as a closed system but in recent decades, anomalously warm atmospheric temperatures have led to increased Greenland melt, driving an important external forcing to the Arctic Ocean–NA system. Recent assessments of freshwater flux from Greenland show that during 1992–2010, this flux to the Arctic Ocean and NA increased by 36% (Bamber et al., 2012). We speculate that the excess freshwater transported into the NA may have significant impact to deep convection (with subsequent atmospheric cooling and reduction of cyclonic activity). The effect would be to impede the decadal oscillations that were a feature of the observations.
To examine this central idea, we ran a multi-box model simulation to test our hypotheses with and without fresh water fluxes from Greenland. The control model run with no freshwater flux from Greenland reproduces quasi-decadal oscillations between anti-cyclonic and cyclonic regimes that are similar to climate regime alternations before 1997.
The addition to the system of freshwater flux from Greenland resulted in significantly longer anti-cyclonic regimes (more than 20 years), consistent with observations after 1996.
A doubling of the volume flux of freshwater from Greenland to the NA (not inconceivable in the future given present warming and Greenland melting trends) resulted in extreme changes in the system behavior with anti-cyclonic regimes dominating for more than three decades, and separated by cyclonic regimes with 3 to 4 years duration.
These idealized modelling results are consistent with our broad hypothesis that additional freshwater fluxes from Greenland melt may be sufficient to suppress previously established Arctic decadal variability. In the experiments described above, freshening of the upper NA plays the key role in disrupting the auto-oscillatory behavior of the Arctic Ocean–NA system.
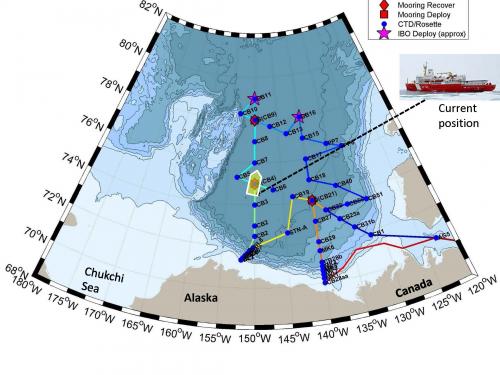 Our location.
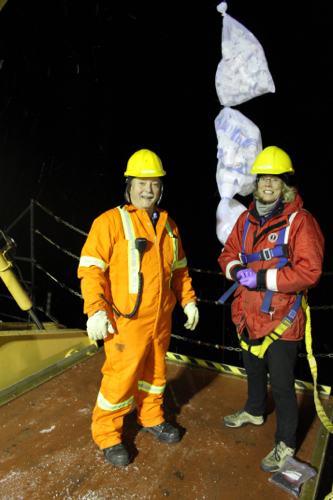 Dave Pike, Quartermaster on the CCGS Louis S. St. Laurent and Sarah Zimmerman at the annual cup lowering. Photo by Gina Nicoloff.
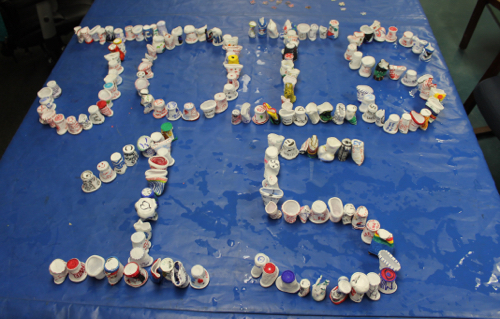 The shrunken cups after being submerged in 1000+ meter Arctic sea water. Photo by Gina Nicoloff.
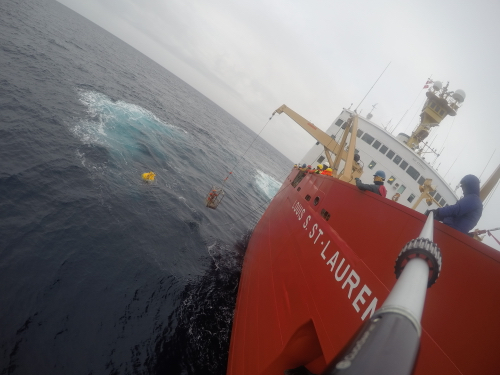 A Mooring ball is chased down for recovery. Photo by David Jones.
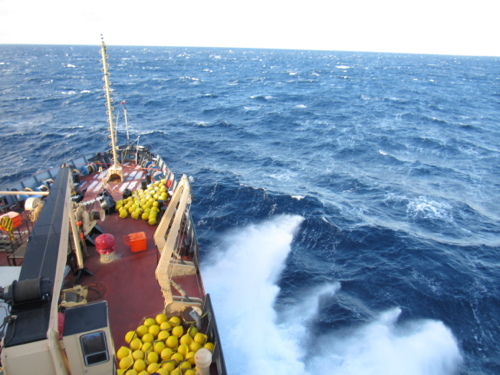 The bow of the CCGS Louis S. St. Laurent plows through rough seas in the Beaufort Sea. Photo by David Jones.
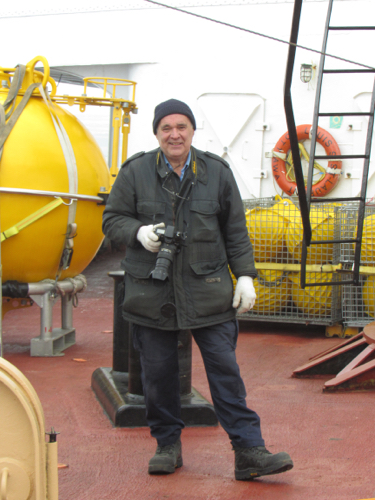 Gary Morgan, ship's Carpenter on the Louis S. St. Laurent on deck with his camera in tow. Photo by David Jones.
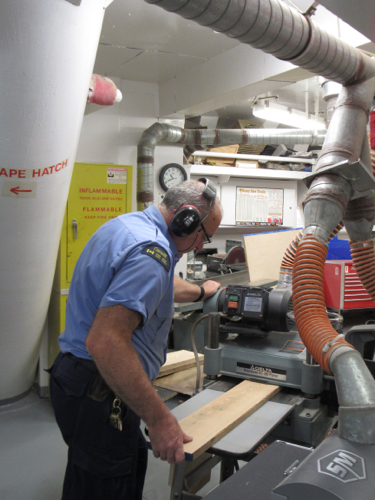 Gary Morgan works in the ship's woodshop. Photo by David Jones.
 Cassie DeFrancesco (Trent University) peers out from her scarf. Photo by David Jones.
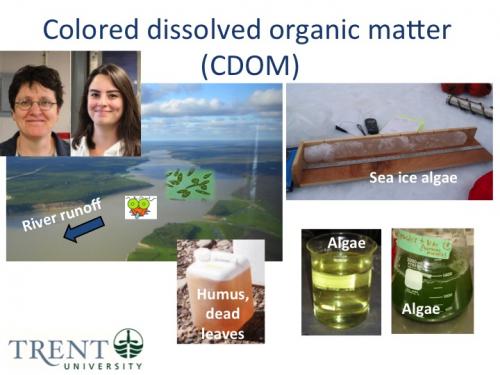 Celine Gueguen (Trent University) and Cassie DeFrancesco (Trent University) run the ships CDOM analysis as part of the JOIS 2017 CTD Rosette program. (Courtesy of Celine Guegen).
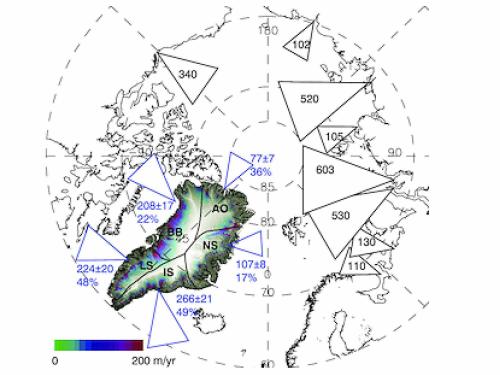 Map showing the scaled magnitude of fresh water flux (the area of each triangle is proportional to the flux) for the five NA regions (AO – Arctic Ocean; NS – Greenland Sea; IS – Irminger Sea; LS – Labrador Sea; BB – Baffin Bay) and the eight largest rivers transporting fresh water into the Arctic Ocean. The numbers indicate the mean fresh water flux in km3yr−1 for the reference period 1961–1990 for each region and the percentages refer to the relative increase in flux for the period 1992–2010, based on a linear trend. Courtesy of Jonathan Bamber (Bamber et al., 2012)
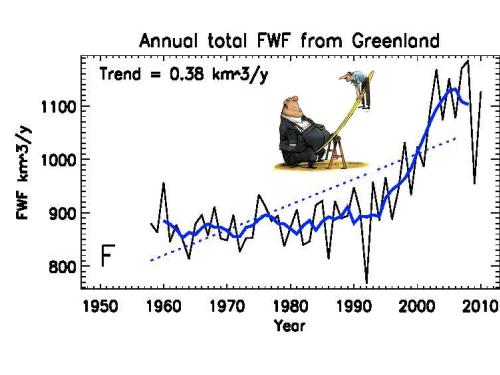 Total fresh water flux from Greenland as the major factor responsible for the cessation of quasi-decadal oscillations of climate in the Arctic. Courtesy of Jonathan Bamber (Bamber et al., 2012).

Comments
Add new comment