I asked Marcy, the UTIG cartographer this question. "How do we start making maps of the seafloor?"
She started by telling me about multibeam swath bathymetry sonar maps. Bathymetry maps are topography maps of the land underwater. We are all used to seeing topography maps of landforms above sea level like mountains and plateaus, and these maps are very similar but they show the formations on the seafloor. The data for these maps is collected through sound or sonar. It works much the same way as your voice would echo if you yelled down a canyon. Sound is sent out at a certain frequency from instruments installed across the bottom of the ship. The sound travels through the water, hits the seafloor then bounces back to the ship. We record the time it takes for the echo to return. Since we know the rate at which sound travels in water we can then calculate the distance to the seafloor, and therefore know the depth. Swath bathymetry means that the sound is sent down in a wide fan shape with many pings a one time that can cover a wide range of the seafloor. This is much more advanced than the old days when sonar was done with just one simple straight-line ping. Even before this, sailors would lower a lead weight on a string until it hit the seafloor and then measure the string. The next step is cleaning the data; this is done by editing out the bad points. Bad data points occur when the ship encounters higher winds and waves or ice. Airs, bubbles, and ice interfere with the sonar's ability to send and receive sound accurately. The clean data is then grided, which is a surface fit to all our recorded points. Once the data is on a grid, the map can be contoured and colored to create more of a 3-D image. Marcy then makes specific additions like stars for dredge site locations and draws a line showing the ship's track. Daily these maps have been created, used, and printed for a variety of scientific purposes. Another map that she creates is a magnetic anomaly map. First, we all need a little background information to understand these maps. The earth is composed of 4 basic layers, the inner core, outer core, mantle, and crust. The outer core is made of very slow moving molten metals and its movement creates the earth's magnetic field. The earth then forms a dipole with north and south poles. These poles have switched in the earth's past, but we don't really know how that is caused. So, rocks are being made all the time and most rocks have some magnetic substance in them like iron, and the magnetic materials in the rocks align themselves with a pole. Just like a needle on a compass. We can then use the magnetometer to collect and record the magnetic field of rocks on the seafloor. They are called magnetic anomalies because they are "what's left" when we do calculations to remove the earth's regular magnetic field.
When Marcy plots magnetic anomaly data on a map, it looks like a wavy or wiggly line. Scientists studied these wiggles and found symmetrical wiggles on both sides of rifts or spreading centers on the seafloor, and when the wiggles were plotted on a line and colored in more patterns and symmetry were revealed. Scientists were then able to develop a time scale based on the patterns of the wiggles through Cretaceous time (about 160 million years ago). We are collecting wiggles in the Scotia Sea to help correlate the age of the seafloor rocks and the orientation of the magnetics, so that we might learn about when and in what direction the Scotia Sea opened. We are doing this by combining both our new data with previously recorded magnetics data from this area.
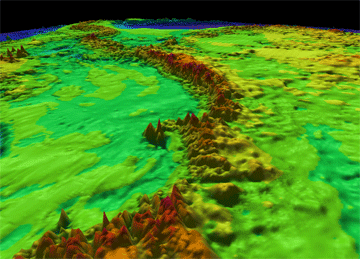
Marcy has also been using this very cool 3-D visualization software called Fledermaus with the multibeam sonar data. She imports the edited multibeam data and grids it with longitude, latitude, and depth to produce detailed 3-D images of the seafloor. The colors of the images are customized based on depth. The shallow sections are red in color while the deeper parts are blues. Once the images are completed, Marcy can get even more detailed features in the images by adding pretend early morning or late afternoon sunshine to the images, which produces the biggest shadows due to the extreme angle of the sun. The really fun thing about Fledermaus is its navigation. You fly through the images like you are in an airplane and you can even go under the ground-it is very cool!
 This is a Fledermaus screen capture of Antarctica. You are looking at the Ross Sea and Trans-Antarctic Mountains. This image has taken away the ice sheet, snow, and ocean, so now all that you see is the rock or continental crust.
