It’s time for a physical geography lesson about Svalbard and our study area, and we’ll let the climate drive the lesson since it involves all aspects of the physical geography of Svalbard. You may want to have that map or globe ready!
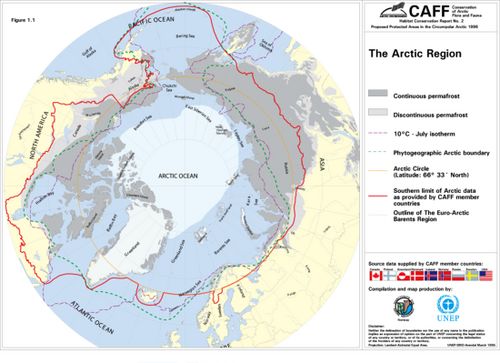 Note the lines marking different zones The Arctic region. (1996). In UNEP/GRID-Arendal Maps and Graphics Library. Retrieved 17:19, July 18, 2008 from http://maps.grida.no/go/graphic/the_arctic_region1.
First of all, we have to remember that most of us live in the middle latitudes with the "westerlies,” and the Arctic is far north of there! Let’s start off by talking about the temperature ranges here is Svalbard which range from cool to cooler to cold and colder! Actually the winter temperatures range from an average of -26°C to -3°C (hmmm, what’s that in the Fahrenheit scale?!) and the summer temperatures range from an average of 4°C to 7°C. The average daily temperature during our stay here in Svalbard is 6°C. Keep in mind that the sun remains above the horizon meaning that there is not much of a diurnal temperature range, although the glaciers do respond to the daily change in location of the sun.
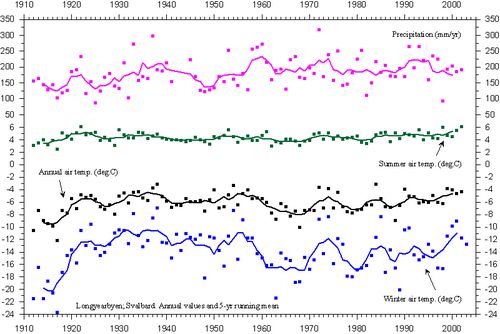 Look carefully at the graph for trends. Data and graph courtesy of Ole Humlum
In regards to precipitation, Svalbard only receives about 200mm/year which is not as much as one would expect in the Arctic, although because of the wind effects, the snow amounts are sometimes stated as being much higher. The driest months are April and May and the wettest months are December to March and August to September with some variation in the timing and intensity of the precipitation, although the precipitation falls in the form of snow. The snow begins to melt in May and temperatures start to drop again around July 21st. Notice the general warming trend where from 1915 to 1922 Svalbard saw the greatest amount of warming; we will refer to that in a future journal entry! If you would like more detail on the various winter and summer warming and cooling trends during the period back to 1912, you will find it on the link.
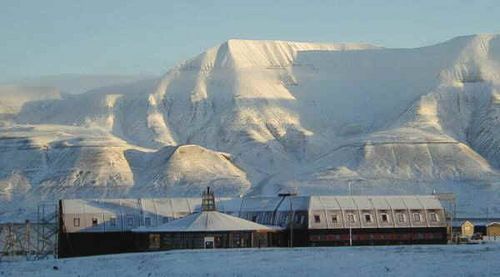 Snowfall amounts in the fall. Image courtesy of Ole Humlum
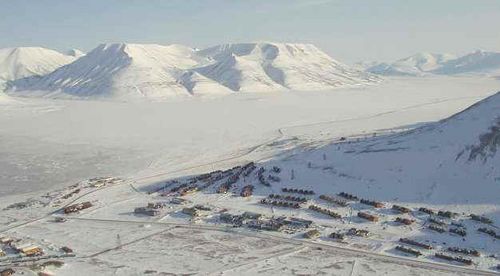 Snow totals in the spring. Image courtesy of Ole Humlum.
We can say that there are both continental and maritime influences on the climate in the Arctic leading to variability in the climate. Here in Svalbard the climate results from the effects of maritime influences as the cold Arctic air converges with the mild maritime air moving up from the North Atlantic and through the Greenland Sea and across the Barents Sea. Within the Arctic there is a pattern of semipermanent pressure zones that tend to steer the air circulation of this region. The most influential pressure system for Svalbard is the Icelandic Low where it tends to be most intense in the winter and weakens in the summer. Also found in this region are polar lows which are smaller scale cyclones that form as the cold Arctic air moves down from the polar regions over a warm body of water. Also influencing the climate on Svalbard and the polar regions are the atmospheric disturbances called the Arctic Oscillation and North Atlantic Oscillation. Both of these have positive and negative phases which can cause the polar seasons to be warmer, cooler, wetter, drier. For more information on these two phenomena check the above link.
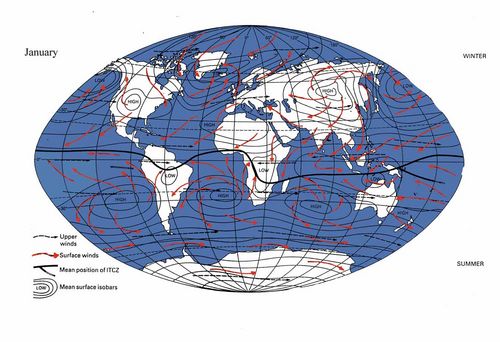 Notice Svalbard. Map courtesy of an atmospheric circulation lecture at St. Andrews UK.
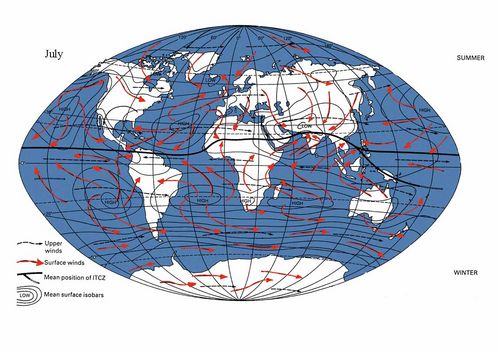 Notice Svalbard. Map courtesy of an atmospheric circulation lecture at St. Andrews UK.
Even closer to home in Svalbard we can look at the direct and indirect influences on the local climate. The direct influences on climate are heat transport (short (sun) and long (terrestrial) wave radiation), stored heat in the form of latent heat, and water phase changes. The indirect influences on the climate of Svalbard are numerous, and as a challenge decide on which of these influences the climate in your home town the most.
Time of day & the receipt of solar energy
Time of year & receipt of solar energy
Latitude & the receipt of solar energy
Surface type & albedo (percent reflectivity), heat storage, moisture content, and vegetation type
Elevation – especially when the sun is up 24 hours, but at a low angle
Synoptic activity – movement of weather systems
Clouds
Local topography – can direct winds up and down a valley
Ocean currents and convection – transport heat via moving water
Now it’s time for a quiz on the climate of the Arctic and Svalbard. Go to Polar Climates (http://www.weather.nps.navy.mil/~psguest/polarmet/climate/content.html) and "Proceed to the Factors that Control Surface Temperatures” and then to proceed to the "Interactive Climate Map,” and there you will find a fun map to analyze (click on the crosses to see the temperature for numerous places around the polar regions) and a quiz to test your knowledge. Good luck!
As you can see this lesson can go on and on. Let’s stop it here and continue later with a lesson on the topography and geology of Svalbard, and then glaciation and past climates.
Additional resources on the climate of the Arctic:
Arctic Monitoring and Assessment Programme http://www.amap.no/
Arctic Climatology and Meteorology Primer http://nsidc.org/cryosphere/arctic-meteorology/index.html
Climate4you http://www.climate4you.com/

