Today we got out to begin collecting data. After breakfast we had a meeting of the research team to strategize how to do data collection today. Julie stayed back to do work on her computer, and Ross and I drove two boats. Ross' boat spent the day trying to take sediment cores using the gravity corer while the boat I drove spent the day doing three different measurements. Before we started, Rebecca and Daksha had to do some work calibrating the winch cable as the length counter is broken.
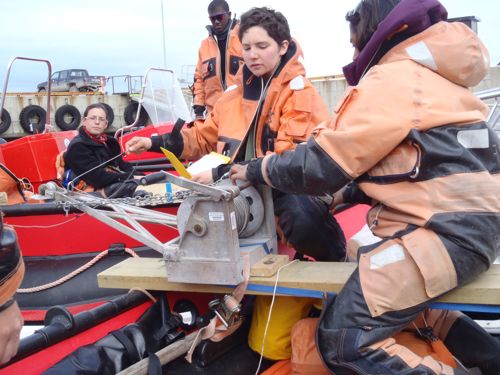 Rebecca and Daksha work on calibrating the winch cable. Unfortunately the length counter is broken, so it had to be calibrated by turns.
Downloading water level data from the HOBOs
We started our time at the glacier having Rebecca retrieve two HOBO water level probes she had deployed into the fjord yesterday. The purpose of these probes is to monitor the glacier's calving events over time. Rebecca is interested in understanding what causes changes in calving in glaciers – for example, could changes in the properties of sea water affect how often ice calves off the glaciers? Another example might be whether the calving of glaciers is affected by tides – are there more calving events during high tide, for example?
Anyway, Rebecca will be monitoring every calving event that occurs over the next few weeks. The HOBO devices that determine the water level (by measuring small changes in water pressure) will record data for about 36 hours until their memory is full – so about every day she will need to go out and download the data.
She deployed two HOBO devices – one on each side of the fjord close to the glacier front. She decided to bring her computer with her – this way she could simply download the data and clear the memory, which only takes a minute or two, rather than bring the device back to the lab. Of course there's the obvious risk of bringing a computer outside and in a boat. Fortunately Rachel lent Rebecca her water-resistant computer case and then she put the computer into a dry bag and tied it down to the boat.
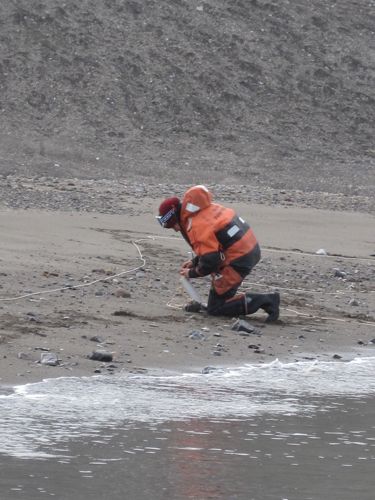 Rebecca retrieves the HOBO from the beach area near the delta.
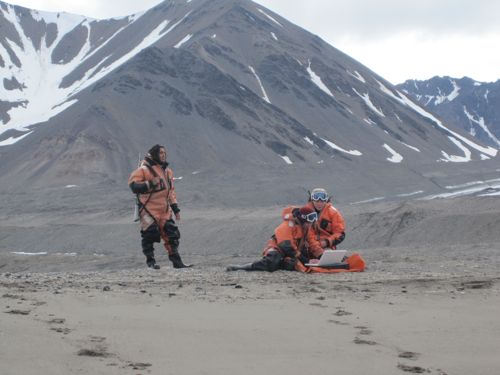 Who says Science is not an adventure? Rebecca and Liz uploading the data from the HOBO to the computer. Daksha stands guard for Polar Bears.
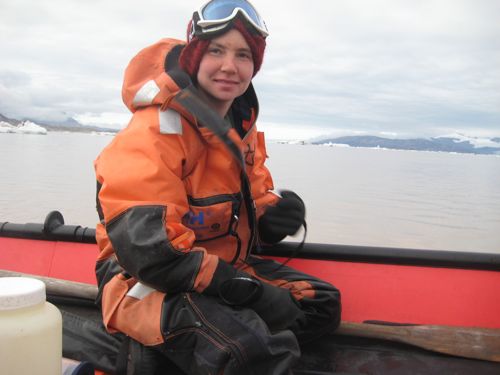 Rebecca, looking pleased after a successful uploading of HOBO data. (Photo from Liz Ceperley)
When we got back to the lab, Rebecca showed me the data she had downloaded from one of the devices. I think the graph is really interesting. You can see the rhythm of the tidal cycle, and then every so often there's a little blip that represents a calving event. Those of my students who have learned about earthquakes might recognize the shape of the waves – they look like earthquake waves recordings from a seismograph. (Can any of my 8th graders explain why the waves from a calving event look like seismic waves?)
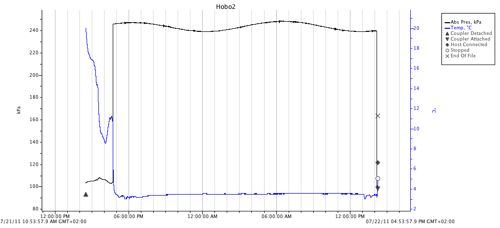 The raw HOBO data - Can you see where the tidal changes are (which happen over a 13-hour cycle) and calving events?
 The raw HOBO data - zoomed in.
Sampling Water
Next on today's agenda was collecting water samples. Liz is interested in understanding the source of sediments and what factors affect differences in the minerals present in the sediments. One of the ways she'll do this is by collecting actual samples of the water in front of the glacier. She chose two places to collect samples which would be highly concentrated with sediment – the first is in a "plume" of sediment that comes out from deep under the glacier – it's basically a huge sub-glacial stream full of sediment that comes out quite fast because it's under pressure. This water is freshwater, and since freshwater is less dense than salt water, it floats up to the surface. So there's a large region of upwelling sediment-filled water in front of the glacier. It's easy to spot because it sort of wells up very turbulently and it's a murky brown color. The current moves outward so fast in that area that it's generally free of ice.
While we were sampling water behind the plume area, we were treated to two very large calving events (see videos below).
The second spot that Liz selected for her water sampling was on the other side of the fjord near a large delta of water flowing out from under the glacier. This creates a delta, which is a fan-shaped region of sediment deposits. Liz selected this spot because it's also filled with sediment-laden water.
The actual collection of water samples was pretty straightforward – Liz and Rebecca used a handy device that is essentially a hollow plastic tube with two caps on either end. The caps are held closed with a strong band – you can pull open the caps and hold them open with a contraption at the side of the bottle. So you send the bottle into the water on the end of the winch cable. When you get to the desired depth, you send down a weight on the winch cable (called a "messenger"). The weight makes the ends of the bottle close, and you get your sample. The water is then poured into a large bottle to be taken back to the lab.
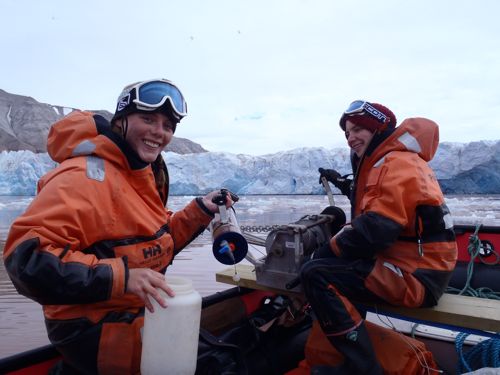 Liz and Rebecca showing off their water sample from today.
The tricky part for me, the boat driver, is to try to keep the boat in one specific point while the sample is being collected. Fortunately Daksha was looking at a GPS unit which told me where we were; she would tell me how to maneuver the boat so it didn't drift much away from the point where we started. This was tricky because the current is so strong in both the plume area and the delta area.
Upon return to the lab, Liz then put her sample in a setup that literally vacuums out the water through a fine filter, leaving the sediments behind. At a later date she can then analyze the sediment samples to determine what minerals are present – this will help her determine the source of the sediments (which can help her reconstruct where the ice from this glacier has been).
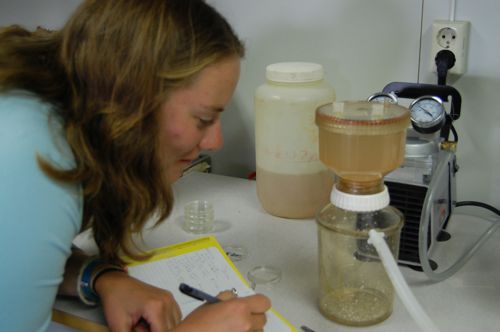 Liz vacuums the water out of her sample so she can analyze the sediments in the water
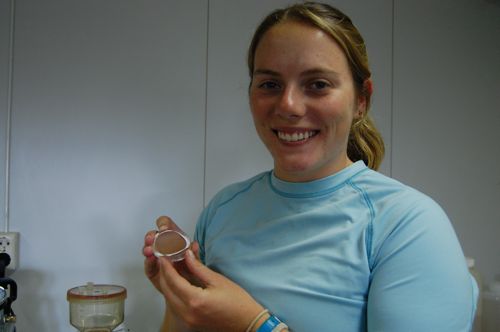 Liz proudly displays her first sediment sample
Water Properties
Our last item on today's agenda were the "CTD casts". You might recall from previous journals that CTD stands for "conductivity, temperature, depth". The conductivity tells you information about how salty the water is, and that can be connected with temperature and depth data to get a sense of the physical properties of water in different regions.
Daksha is interested in seeing how the physical properties of water are affecting the ice – for example, how might warmer water from the Atlantic be mixing with the colder, less salty water close to the glacier, and how might that affect the way the glaciers are melting?
The CTD device is pretty automated – Daksha has programmed it to collect water samples every half a second. She then attaches it to the winch cable and slowly lowers it down.
Again, my job during this process was to keep the boat in a stationary position.
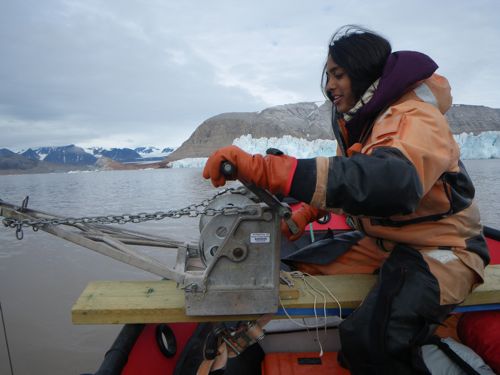 Daksha working the winch during a CTD cast (photo from Rebecca Siegel)
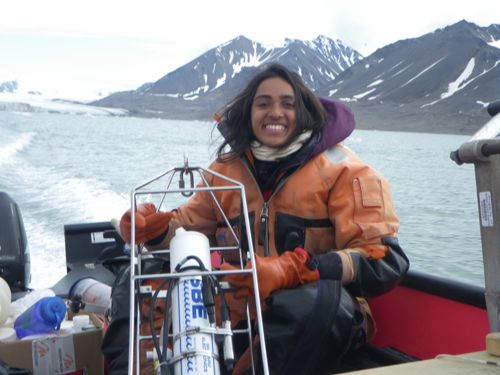 Daksha holding the CTD device (photo from Rebecca Siegel)
 Liz recording GPS coordinates during the CTD deployment (photo from Rebecca Siegel)
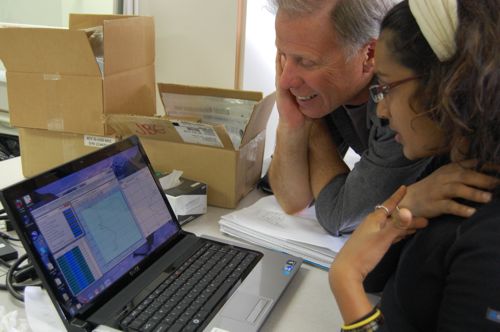 Daksha shows Ross some of today's CTD data
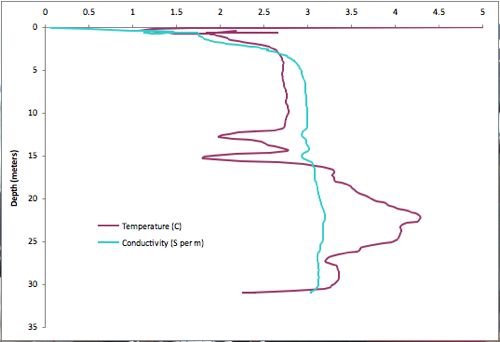 CTD data from today. Note how there is a clear change in temperature and salinity in the middle of the water column - this probably indicates a different layer of water, perhaps sediment-laden water coming from the glacier.
What a day of Ice!
One of the things that became evident quite early on today was the incredible amount of ice in the fjord. In order to get to the glacier front, we had to drive through a very thick "slush" of tiny icebergs that had all been pushed together. I have learned that the strategy is to drive as slow as possible and avoid the larger bits... fortunately these boats are pretty tough.
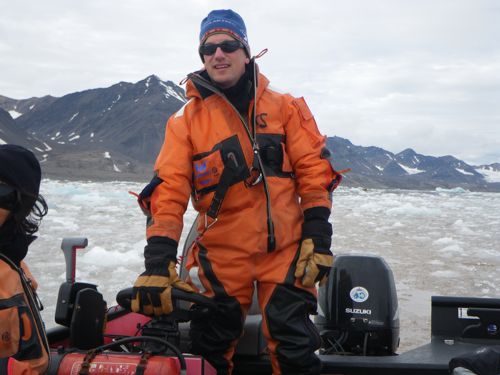 Driving the boat through very dense ice. This felt like driving through slush. (Photo by Liz Ceperley)
 Gulls on one of the hundreds (thousands?) of icebergs we saw today.
The highlight for me, however, was seeing two spectacular calving events. For both we were probably about 300 or so meters from the ice front, so it was close enough to really feel the wave that comes from a large chunk of ice falling into the water.
The video quality is not great, as I was both driving and filming at the same time. But you can get a sense of how spectacular it was to be right there!
http://youtu.be/Qh9BtFXNBLk
http://youtu.be/NlLxVBsoHaM

