Journal Entry

A windy but successful start

Today we had a full day out on the fjord. Our main objective was to test out the CTD, water sampler and velocity meter. I also got a chance to do more drone flying.

As we drove the boat out towards the glacier face the wind really picked up and the waves seemed too rough to do data collection. But we found a protected bay on the North side of the glacier where the wind was light, and we were able to do our first CTD casts and water sampling.
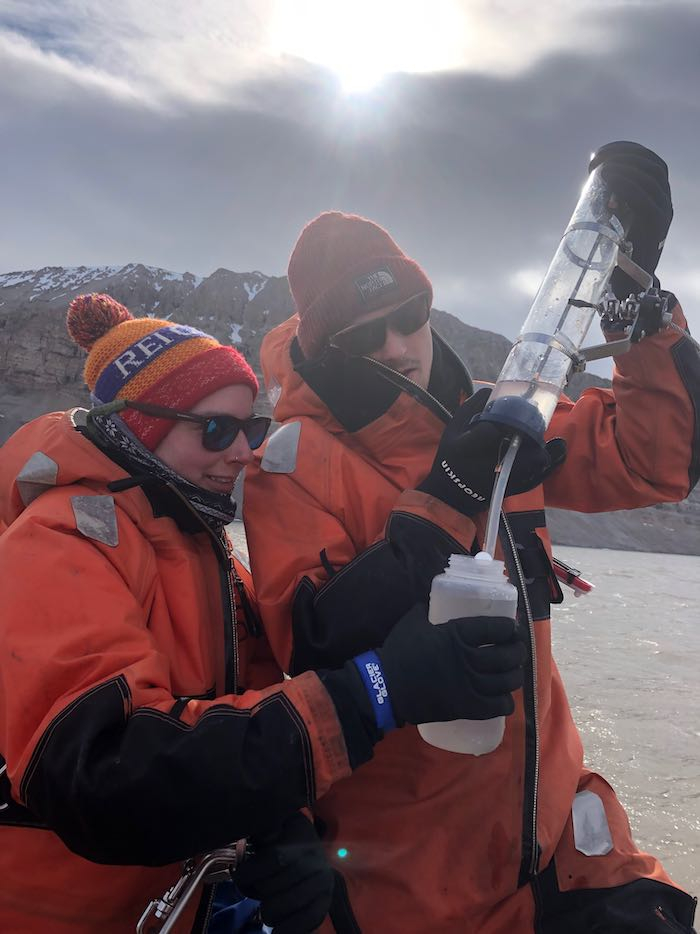
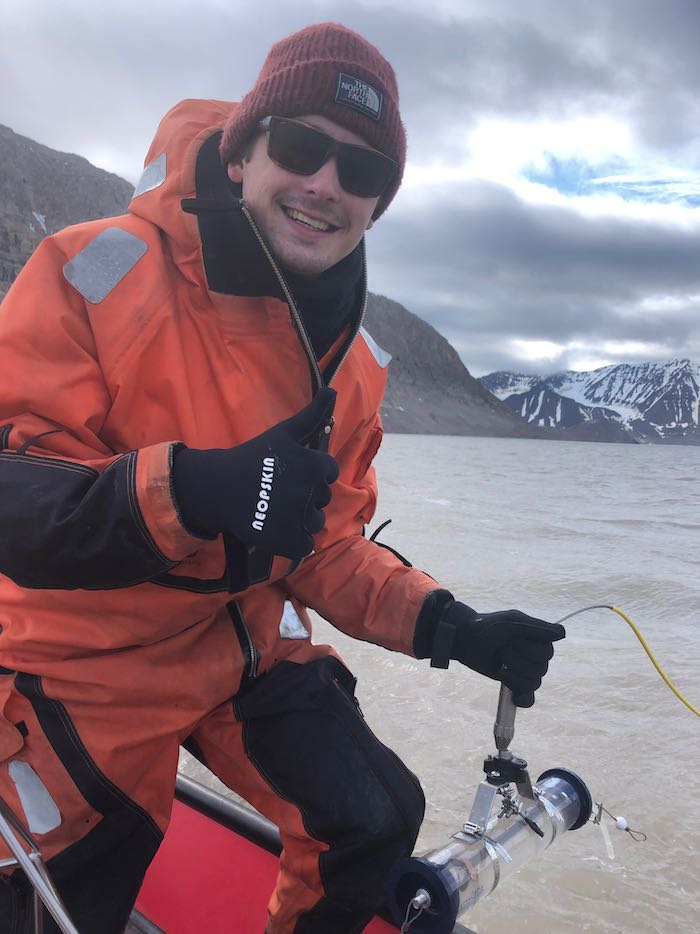
Water samplerXander and Kelly emptying a water sample. Water samplerXander gives a thumbs up after the first water sampling.
I took this short video of Xander and me doing a CTD cast so you can see how the process works. The CTD device automatically collects data once you turn it on, and it detects the depth using a pressure sensor.

As we started to head home, we realized that the wind had died down in front of the main part of the glacier, so we headed over there to take more CTD casts and water sampling. Xander and Kelly also tested out the velocity meter. Unfortunately it seems that the drift of the boat will interfere with the ability to get reliable measurements, so we will be looking into another method to measure water velocity. (Stay tuned for the very old-fashioned method we may use to find the water velocity.)
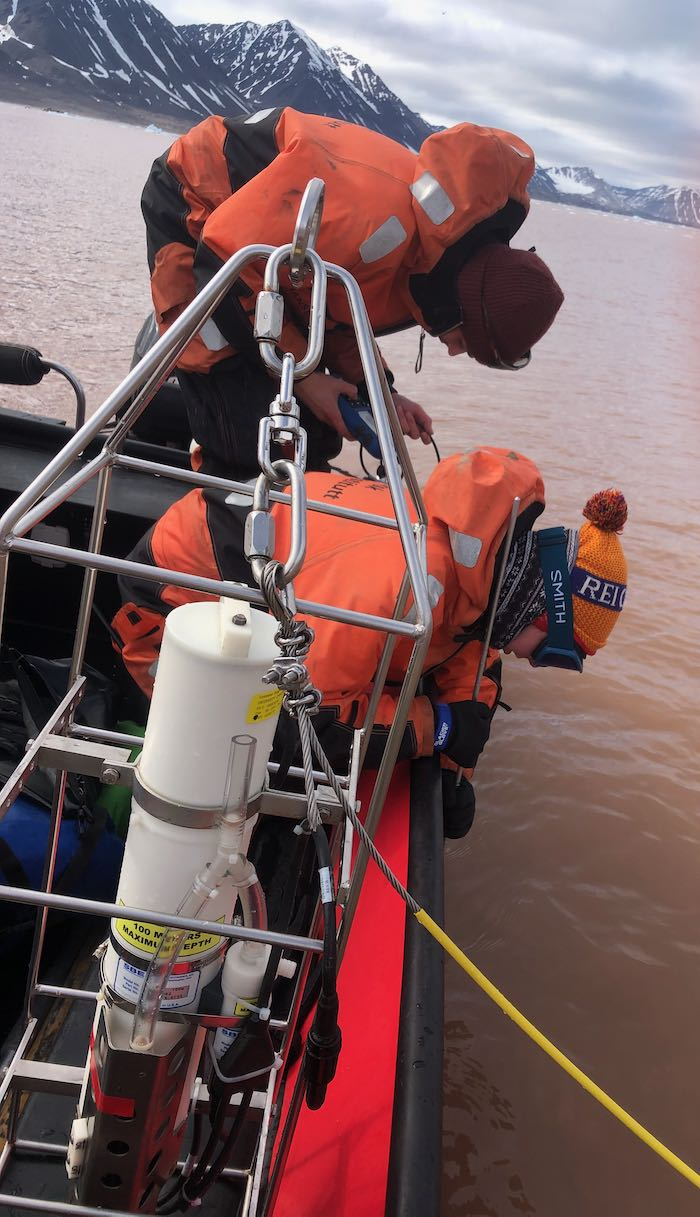
Testing the velocity meterKelly and Xander testing out the velocity meter.

The data is beginning to tell a story

When we got back, Xander was able to download the data and begin processing it. Check out the graph that he created.
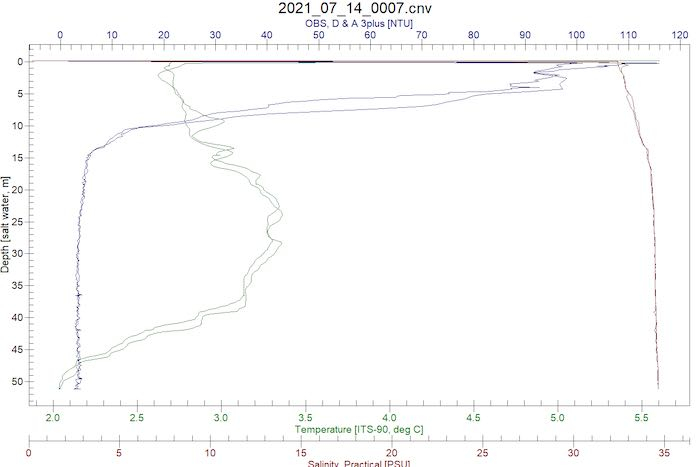
Graph from a CTD cast. Graph of one of our first CTD casts.

This one graph already tells an interesting story. The y-axis (vertical) is depth from the surface (zero) down to 50 meters. There are 3 different things being graphed on the X-axis. The Green lines show Temperature, the Blue lines are Turbidity (how cloudy the water is) and the Brown lines show salinity (how salty the water is). There are two lines because the CTD device collects data on the way down and again on the way back up.

Notice on the graph how the salinity is low at the very top, and then it shoots up and stays at a steady value all the way down to 50 meters. Then, the water is super cloudy all the way down to about 7-8 meters. Also notice that the temperature gets a bit higher between about 10-40 meters and then it gets very cold at the bottom. This data was collected at the outside edge of an upwelling plume - where water exiting the glacier comes out into the ocean.

I won’t explain this little bit of data right away. Here’s a little puzzle for you - especially if you’re one of my students. What ideas do you have about why the water would be more cloudy and less salty at the top than at the bottom? And why do you think the temperature might rise a bit in the middle, and then get very cold at the bottom?

More drone footage

The conditions had calmed down so much that I was able to do some drone flying. I was able to practice flying alongside and over the glacier, and I even caught some calving events.

Check out this video I took from today’s drone flight. I think you’ll agree that the scenery is spectacular, and that we are incredibly lucky to get the chance to be here! From the footage we were able to see that we should be able to use the video to help characterize what is happening to the subglacial jets as they exit the glacier. Notice how brown the water is! This is evidence of the amazing amount of sediment carried by the glacier.

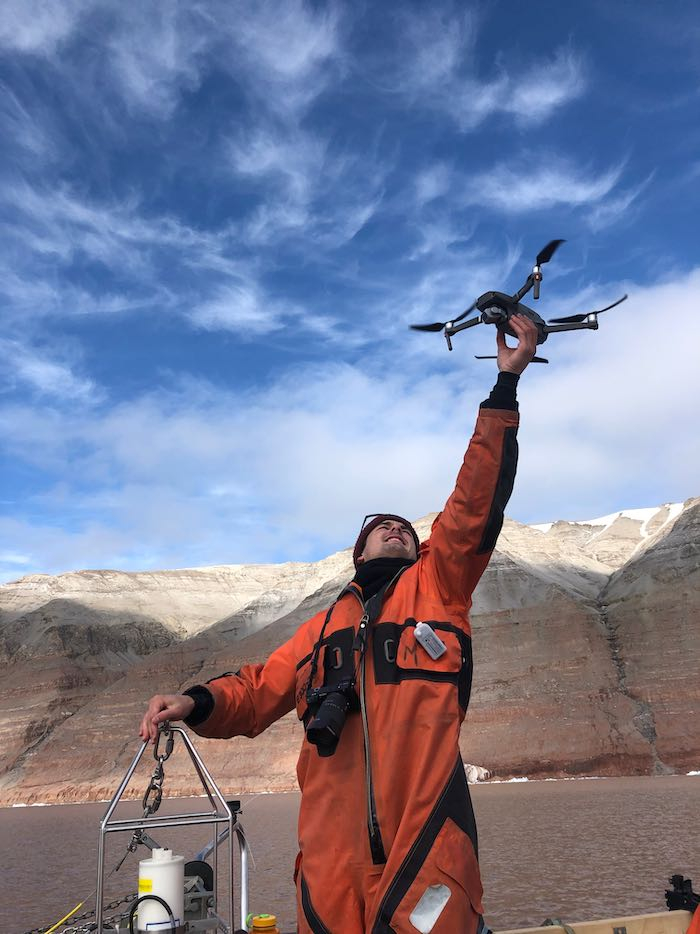
Flying the drone from a moving boat is a bit more of a challenge than I expected, especially landing the drone. Since you are on a moving base, you can’t just have the drone fly back to its starting point. And the drone has several anti-collision detectors that it takes a bit of practice to catch it. Xander has become quite adept at catching my drone.
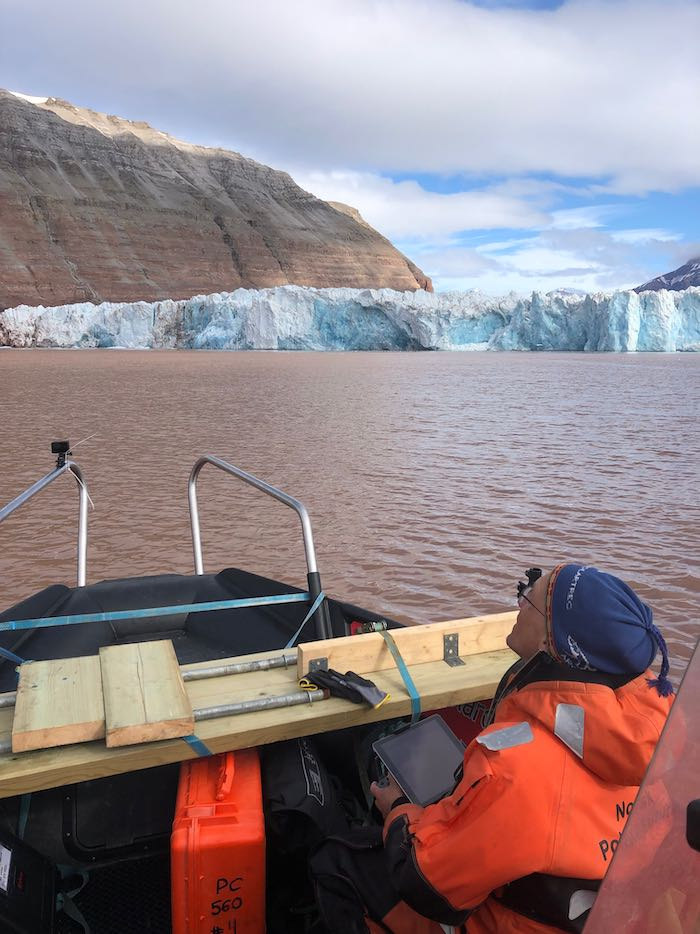
Flying the droneHere I am using my ipad to fly the drone. Catching the droneXander expertly plucks the drone from the air.
Heading home

On our way home, we took a little tour of a very heavily sediment-laden iceberg. Here’s a little video I took. This iceberg came from the bottom of the iceberg, and you can see the huge amount of sediment it is carrying.
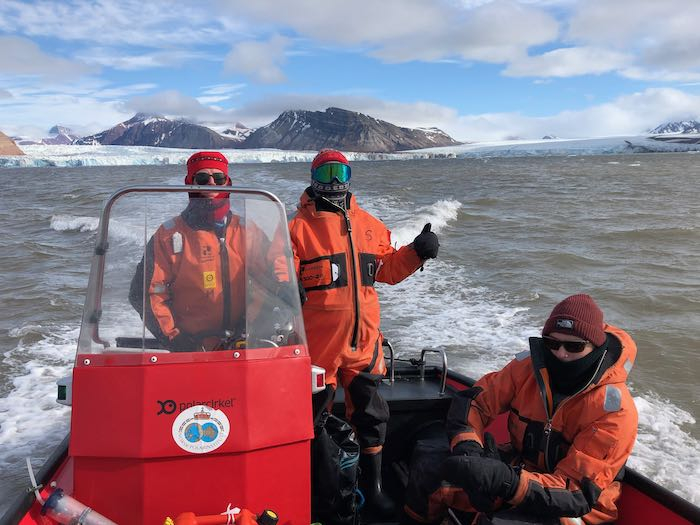
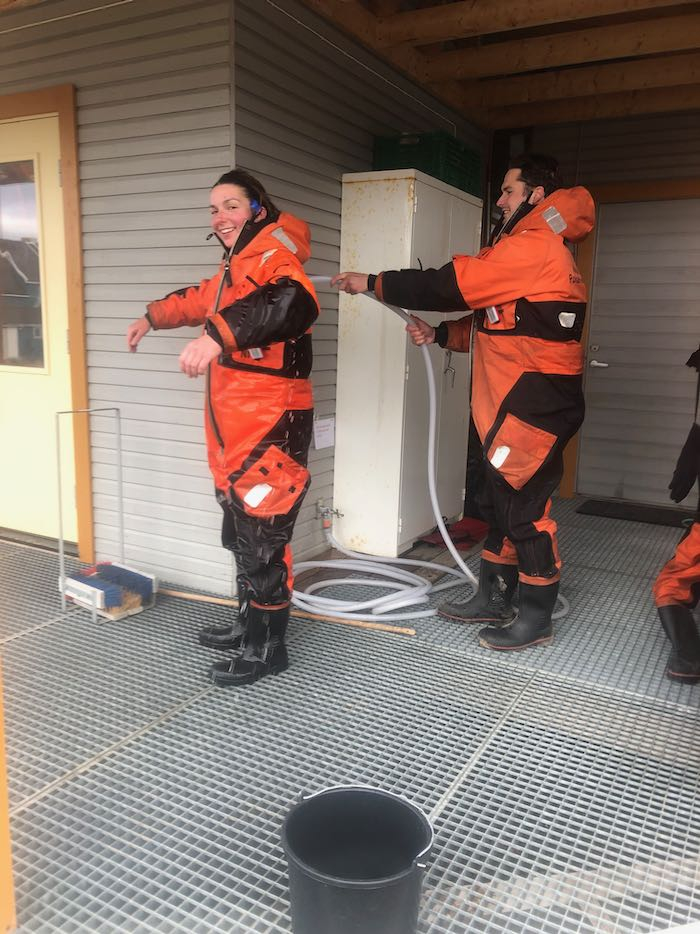
Driving home from the fjordDriving home after a successful day of data collection. Spraying off the survival suitsAfter we got back, we needed to spray off the survival suits since we got quite a bit of saltwater spray on our trip today!
Comments

David L

The shot from the drone looks amazing! I think there is less salt at the top than the bottom because the salt makes water more dense so it sinks. For a question, Why is it safe to be near an iceberg but not a glacier if an iceberg is part of a glacier?

Mark Goldner

Hi David, yes, you are correct about the density of salt vs. fresh water. The danger from glaciers is that they can be 100 feet high or more, and are constantly shedding large blocks of ice (icebergs) which could be catastrophic to a boat if it hit you. Even if you weren't hit by an iceberg, the waves they create could easily capsize the boat.
Icebergs aren't always so safe to be around, though. Sometimes they can flip over as they melt and become unsteady. We have learned to keep our distance from icebergs that appear to be unstable or if they have too much ice sticking out of the water.

Binny

Hello Captain

I just jumped in yesterday into the blog. WOW looks amazing, especially the shots from the drone. Have you thought about upgrading it to a floating/sea drone?
It is very concerning to read how much the glacier lost ice and retreated, since the last time you were their.
Did you have a chance to run?
Keep on researching and have fun

Mark Goldner

Hey Captain Binny! I wish I had a waterproof drone. Mine was almost lost to the sea yesterday...
No outside running yet - we've just been too busy! We need to schedule it so that I can get an escort with a gun riding a bike next to me. (Maybe I'm fast, but not "polar bear fast"...) But there's a nice little gym with some treadmills so I've hit that a couple of times.
Be well!

- Mark

Charlotte Pappas

Mr. Goldner,

Foremostly, the data that your team collected about the temperature, turbidity, and salinity of the ocean surrounding the glacier you are studying using the CTD device seems interesting. I can notice based on the graph that was created to show this data from the CTD device that the water closer to the surface of the ocean had a greater amount of turbidity, a lower amount of salinity, and a warmer temperature, as within the first 10 meters of the ocean, the water had an nephelometric turbidity unit of around 60 to 110, an practical salinity unit of around 25 to 33, and a temperature of around 3.25 to 5.5 degrees Celsius. However, I also notice from the graph that as the water got closer to the bottom of the ocean, its turbidity levels went down, while its salinity levels went up, and its temperature dropped, as within 40 to 50 meters of the ocean, the water had an nephelometric turbidity unit of around 5, a practical salinity unit of around 34.5, and a temperature of around 2.75 to 2 degrees Celsius.

Furthermore, I think that the reason that the water of this ocean would be more cloudy and less salty at the top of it than at the bottom of it is because I know that water near the top of the ocean holds more water vapor then water near the bottom of the ocean. Therefore, since water vapor is water in its gaseous state that eventually condenses, forming cloudy water, therefore, since the top of the ocean holds more water vapor, it would have more cloudy water than water near the bottom of the ocean.
Moreover, I also know that evaporation of ocean water and formation of sea ice both increase the salinity levels of water, which means that since the evaporation of ocean water and sea ice formation happen on or near the surface of the water instead of near the bottom, it results in water near the top of the ocean to have greater salinity levels then water near the bottom of the ocean.

In addition, I think that the reason why the water temperature might rise a bit in the middle of the ocean, and then get very cold at the bottom of the ocean is because I know that the way convection currents work in the ocean is that they travel in a cycle where the warmer and lighter air rises to the surface of the ocean, while the cooler and denser air sinks down to the bottom of the ocean. Hence, since the warmer air is traveling to the surface of the ocean, it passes through the middle of the ocean, which can cause the temperature in that area to rise, but since the colder air does not travel to the surface, and goes straight near the bottom of the ocean, it causes the temperature in that area to stay low.

Withal, one wondering that I have about this post is that why is the data showing that the temperature in the middle of this ocean is warmer then the surface of this ocean, as due to the convection currents, the surface of this ocean should have the warmest temperature, so is there another factor that can affect ocean temperature?

That is all of my thoughts for now.
Charlotte

Mark Goldner

Hi Charlotte, really great job analyzing the data from the CTD graph! I wonder if you are confusing turbidity or "cloudiness" with clouds in the atmosphere, although I really like your ideas about how evaporation might contribute to the properties of the ocean water. What is going on here is related to the sediment in the water released from the glacier. You might remember from 7th grade science how when glaciers move across the landscape they erode the bedrock beneath them. If you look at some of my photos you'll notice how incredibly dirty the glacier looks - that's the sediment being carried along by the ice. All that sediment is deposited in the water as the glacier meets the ocean. There are different ways that can happen. Much of the sediment just falls into the ocean as icebergs calve off into the water. Another way that sediment is carried into the ocean is through sub-glacial streams. Where those streams meet the edge of the glacier, sometimes the water is moving so fast and is under such high pressure that it comes gushing out like a giant fire hose! Those places are called upwelling plumes. The fresh meltwater is less dense than the salt water, so it rises up quickly across the front of the glacier and then spreads out quickly into the fjord. That water is also colder than the ocean water and contains a lot of sediment, which is why the water at the very top has a high turbidity and lower salinity. It's also a bit colder than the water a few meters down. Does that all make sense? There's more to come about these upwelling plumes and what the CTD data is telling us.

Elliot English

Mr. Goldner,
It is awesome you finally get to get out there and do some field studies. Using awesome technology like the CTD scanner. For my question I was wondering what you guys are looking for in the water samples and how what you find helps your study.
Thanks,
Elliot

Mark Goldner

Hi Elliot! Great question. We use the CTD data to help us map where the water from the glacier is coming. If you read my response to Charlotte's comment above it will help you understand that a bit. Basically, we know that water coming from the glacier is colder, less salty, and much more turbid (cloudy) than the rest of the ocean water. So by measuring salinity, temperature and turbidity at different locations and depths in front of the glacier we can try to map out how the water flows out of the glacier. On a large scale we hope that our monitoring of this rapidly-retreating glacier for a few weeks will help people understand a bit more about how glaciers move and change in response to a warming atmosphere. This is important for many reasons, but one important reason is because we need to know how sea levels are rising as a result of this melting ice. And to help people understand why it's so important for us to stop releasing greenhouse gases like carbon dioxide into the atmosphere from burning fossil fuels.

Maya Silk

Dear Mr.Goldner,

First, I think it is so cool that you got to fly a drone. I was reading the first part of your blog and was wondering why the wind would effect your water sampling. I also would like to know if you and your team know the kinds of rock that make up the sediment that build up in the glaciers. Would identifying the types of rock help show where the glacier has been? This is so interesting!

-Maya

Mark Goldner

Hi Maya, great questions! To answer your question about wind, we rely on being able to keep the boat stationary for a period of time, and if it's too windy we can't do that. So in the time it takes to make a measurement, the boat may have drifted quite a bit. Also, it can just be too dangerous to drive a small boat in water that is too rough.

Your question about identifying rock to reconstruct where a glacier has been is a great one! We weren't set up to do that kind of analysis, but people have done that in the past. In fact, when I was here ten years ago, one of the students was involved in doing something like that. She would try to identify the minerals in the sediment, and then compare that to what is known about the bedrock and try to infer where most of the sediment was coming from. It's not an easy thing to do because glaciers come together from several sources (like rivers do) so it's hard to know for certain exactly where ice from a particular glacier has been.

Isabella Shahrooz

Hello Mr. Goldner,
Wow! the view of the glacier from the drone is amazing. I cant believe how big the glacier is. I also noticed on the graph the changes in salinity is different on the way up than the way down why is that? And the changes in the graph for Turbidity is so sudden, why is the surface of the water soooo much cloudier than the bottom.
-Isabella-

Mark Goldner

Hi Isabella, yes it's pretty cool how there are such dramatic changes in the composition of layers of water. We tend to think that water just mixes in a uniform way, and the CTD data is evidence that the water is stratified, in other words, has distinct layers. That is mainly because of changes in density - salt water is more dense than fresh water, and cold water is less dense that warm water.

Add new comment