Atmospheric Research Observatory (ARO)
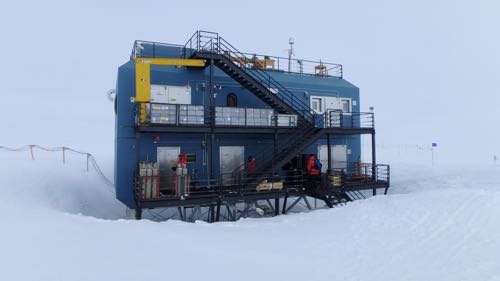
Just a quarter mile walk away from the station is the Atmospheric Research Observatory, more commonly called ARO (pronounced “arrow”). It sits in the “Clean Air Sector” upwind of the station and its powerplant. Gavin and Dave conduct research, funded by the National Oceanic and Atmospheric Association (NOAA), here. You may remember these guys from my previous entry about the Ozone Balloon Launch.
 The Atmospheric Research Observatory (ARO) at the South Pole.
There’s loads of cool research going on at ARO: Ozone, water vapor, black carbon, halocarbons, and greenhouse gases to name a few topics. With six total NOAA station taking data around the world (Barrow, Alaska; Trinidad Head, California; Mauna Loa, Hawaii; Cape Mataula, American Samoa; Summit, Greenland; and South Pole, Antarctica), the combined data can help us learn about these topics at various latitudes.
The Greenhouse Effect
To understand the Greenhouse Effect, we first need to understand what happens to the sun’s light as it makes it way to (and from) Earth’s surface.
- Solar radiation reaches the Earth’s atmosphere.
- Some of this solar radiation is reflected by the atmosphere, the rest keeps traveling until it reaches the ground.
- About half of this solar radiation is reflected from the ground back up into space. The other half is absorbed by the ground, which heats up and emits infrared radiation.
- The infrared radiation is then absorbed by greenhouse gas molecules and re-emitted. Part of this re-emitted radiation is directed back towards the surface of the Earth, heating the ground more.
![A diagram showing the absorbing and reflection of solar radiation as it reaches Earth. (By ZooFari (Own work) [CC BY-SA 3.0 (http://creativecommons.org/licenses/by-sa/3.0)], via Wikimedia Commons) Greenhouse Effect](/files/members/kate-miller/images/greenhouseeffect.jpg) A diagram showing the absorbing and reflection of solar radiation as it reaches Earth. (By ZooFari (Own work) [CC BY-SA 3.0 (http://creativecommons.org/licenses/by-sa/3.0)], via Wikimedia Commons)
A diagram showing the absorbing and reflection of solar radiation as it reaches Earth. (By ZooFari (Own work) [CC BY-SA 3.0 (http://creativecommons.org/licenses/by-sa/3.0)], via Wikimedia Commons)
Greenhouse gases include water vapor, Carbon Dioxide, Methane, Nitrous Oxide, and Ozone.
Greenhouse gases aren’t all bad. In fact, we need some greenhouse gases in our atmosphere in order to maintain hospitable conditions for human life. But when too many greenhouse gases are in the atmosphere, too much heat is trapped and we have some problems.
Venus is believed to be an example of the Runaway Greenhouse Effect. Scientists believe that on Venus, water vapor in the atmosphere trapped outgoing radiation which then causes warmer surface temperatures. This in turn made water evaporate into more water vapor that then trapped more outgoing radiation…and the cycle goes on and on until, we believe, all of Venus’ oceans boiled away. Venus is now the hottest planet in our Solar System.
Carbon Dioxide in Our Atmosphere
Water vapor is the primary greenhouse gas in Earth’s atmosphere. The amount of water vapor is fairly stable as it comes primarily from our oceans. The second most prevalent greenhouse gas in Earth’s atmosphere is Carbon Dioxide.
With the start of the Industrial Revolution, human activity began to add Carbon Dioxide to the atmosphere. In the 1950s, we started taking data on how much Carbon Dioxide was present.
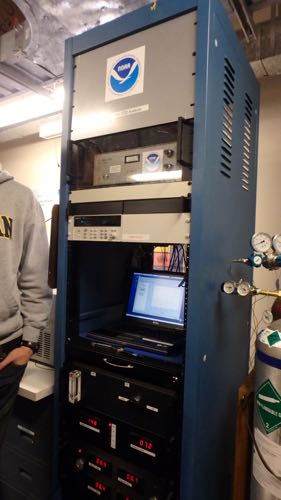
 The instrument that measures Carbon Dioxide in Earth's atmosphere at the ARO lab.
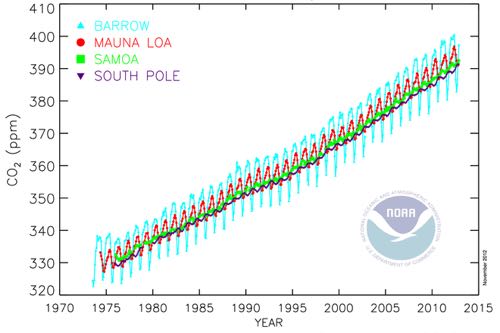
The graph below shows Carbon Dioxide levels from 1970-2014 as taken by NOAA, measured in parts per million (for example 300ppm would mean there are 300 Carbon Dioxide molecules in 1 million atmospheric molecules). Data from four stations are shown here – blue is Barrow, red is Mauna Loa, green is American Samoa, and purple is the South Pole.
 A graph of date vs. Carbon Dioxide in the Atmosphere (in parts per million). (This figure was prepared by Robert A. Rohde from publically available data and is incorperated into the Global Warming Art project.)
Overall, notice the increasing trend starting around 330ppm in 1975 to over 390ppm in 2014. The amount of Carbon Dioxide in the atmosphere is rising. Remember, Carbon Dioxide is a greenhouse gas, so the more Carbon Dioxide there is, the more radiation is being reflected back towards Earth instead of escaping into space. It is warming the Earth’s surface.
You may also notice in the above graph smaller oscillations each year, especially for the Barrow data. A dip is seen in Carbon Dioxide when the leaves are healthy and photosynthesis is occurring (photosynthesis takes in Carbon Dioxide); a spike in Carbon Dioxide is seen when the leaves fall off and start decomposing on the ground (decomposition outputs Carbon Dioxide).
Long(er)-Term Data
Okay, so there’s an increasing amount of Carbon Dioxide in our atmosphere in recent (past 50 or so) years. But how does this compare to a longer timescale?
 A graph of time (in thousands of years ago) vs. Carbon Dioxide in the Atmosphere (in parts per million). (Credit: NOAA; https://www.esrl.noaa.gov/gmd/ccgg/about.html)
You’ll notice in this graph there are several “bumps” 400 and 100 thousand years ago. This represents the natural Ice Age cycle of Earth. (This really comes from changes in Earth’s orbit. Google “Milankovitch cycles” if you’re interested in learning more)
Now bring your attention to the far right of the graph labeled “0”, the modern day. Since about 1900, the amount of Carbon Dioxide has dramatically increased beyond the normal cycling. This corresponds to the beginning of the Industrial Revolution. Currently, the amount of Carbon Dioxide is about 400 parts per billion, what we believe to be a record high.
 Taking a sample of the cleanest air in the world on the roof ARO. Today's Carbon Dioxide level was 401.25ppm. I get to bring this sample of air back with me. (It was pretty chilly and apparently very sunny up there…sorry for the squinty eyes)
Or, put another way, check out this xkcd webcomic entitled “The Timeline of Earth’s Average Temperature.”
Main Sources of Carbon Dioxide
Just where is all of this additional Carbon Dioxide coming from? There are three main sources of Carbon Dioxide in our atmosphere:
- Coal plants
- Car pollution
- Shipping freights
So although it doesn’t seem like driving a car to school everyday is contributing to our changing climate, with over 1 billion people owning cars it really adds up. Same with that Amazon package being shipped to you from Europe, or the light you leave on if your energy company uses coal.
Effects
We don’t know for sure what the long-term effects of this recent spike in Carbon Dioxide will be. The Earth simply hasn’t had enough time to fully react. However, using models based on past and current data, scientists have some predictions (based in evidence) of what might happen.
With more Carbon Dioxide in the atmosphere, more radiation is reflected back to Earth. This heats the Earth’s surface. Three of the warmest years since 1880 (when recordkeeping started) are 2016, 2015, and 2014 (source).
As a result of this rising global average temperature, models predict that we will experience dramatic changes in weather patterns. In fact, some of these we are already experiencing:
- Extreme temperature highs and lows
- Increasing overall precipitation rate
- Increased intensity of tropical storms & hurricanes
- Flooding of rivers
- Drought
(source)
These are only a few of the expected effects…there are many more predictions (based in evidence).
A Scientific Theory
Climate change is a scientific theory. But a scientific theory is not just a guess, it’s based in data that is reproducible and robust.
For example, gravity is considered a scientific theory. We have lots of evidence (qualitative and quantitative) to back up the theory of gravity. All of our best predictions based on this evidence tell us that when you drop your pencil, it will fall down. And we trust this with a high level of confidence.
Just as gravity is a theory, so is climate change. The data is clear. As Gavin said, “If you trust the thermometer in your car, you should trust this data.” Whether or not you choose to act on this data and how you take action, is up to you.


Add new comment