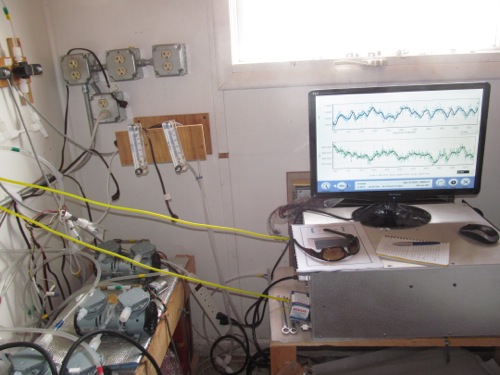
Late the night before, the Greenhouse Gas Analyzer arrived! It's a super awesome, and important, machine that plays a major part in Elliot's research. This device records carbon dioxide and methane emissions over time and displays it in graph and table form. In the morning, Elliot showed me how to connect, operate, and transfer data from the machine.
 The Fast Greenhouse Gas Analyzer is graph-tastic!
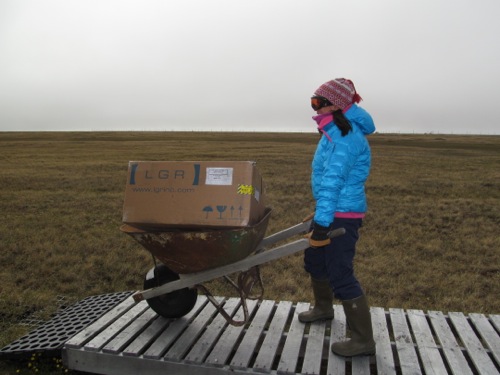
And in the afternoon, we trekked the 1.5 miles out to the site, on foot, pushing the 65 pound machine with my nemesis.....the wheelbarrow! Oh, I didn't mention that before?
My Old Nemesis
Two days earlier, Elliot decided we needed additional matting out in the lake basin. So we used a wheelbarrow to haul out stacks of black matting. I had never used a wheelbarrow before and thought "This can't be so hard, after all it's got a wheel!" I was wrong! First of all, when you get enough matting piled on top of one another, it's very heavy. Then you add to it the fact that the wheelbarrow itself is pretty heavy. So now you're pushing a very heavy thing with lots of heavy things on top of it. Then you have to balance everything. The path out to our site consists of narrow wooden planks or plastic matting over bumpy ground. During my turn handling the wheelbarrow, I tipped it over twice and Elliot had to help me reload the mats. Ugh!
 Why is pushing a wheelbarrow so difficult?
Back To The Story
So thankfully, Elliot magnanimous handled the wheelbarrow today with the incredibly expensive device and I carried the box with the computer monitor, keyboard, mouse and a bag of hand tools. Now don't get me wrong, I helped out too, have you ever carried a computer monitor 1.5 miles in 36 degree weather with 5 layers of clothing on?
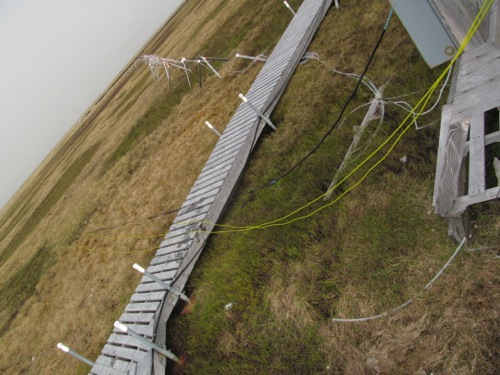
Once we go out to the site, Elliot quickly set up the device and we connected two 50-foot long flexible plastic tubes to the analyzer and ran it out to the lake basin. We did a couple of practice runs and it was a success!
 It'll take about another 100 feet of tubing to get to the second and third sites we'll be sampling from.
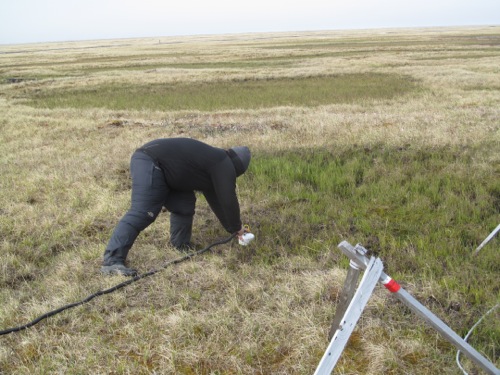
 Elliott connects the yellow tubing to a cap that is placed on top of the soil chambers.
It was actually pretty awesome watching the data points appear on the screen already in graph form. We watched the flux of the graph lines as the carbon dioxide and methane increased, decreased, or just held steady. It was impressive! I know, kinda geeky to be impressed by graphs, but hey, we love science!
So we just need the last shipment box containing the soil chambers and we're in business!

