On Fragile, Speedy Ice
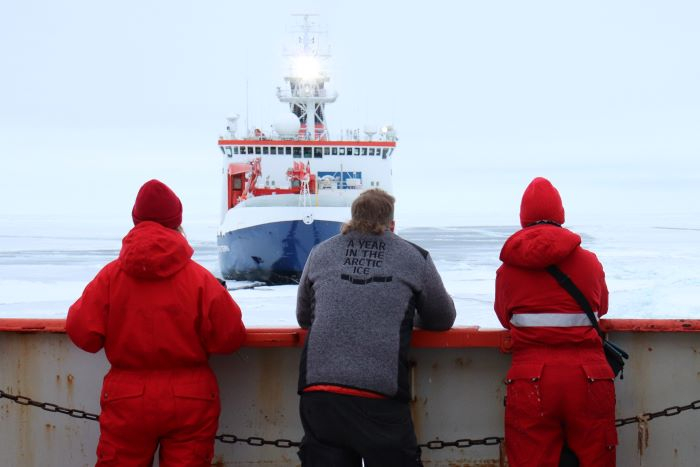
The expedition jacket I have from the MOSAiC Expedition reads “A Year In the Arctic Ice.” While this statement was never true for any individual expedition member, it did reflect the concept at the heart of the MOSAiC Expedition: that the R/V Polarstern would freeze into the Arctic sea ice for nearly a year. Surrounding this vessel, a staggering array of scientific equipment makes up the main ice floe where incredible research takes place, gathering data every day for an entire year. Or close to it. The expedition leaders were never quite certain if the chosen ice floe would last until late August, or September, or October before became thin and broke into pieces or exited into the North Atlantic and melted. But no matter what, it would be close to a year. Even in the ‘new Arctic’ all projections were that it would last almost a year.
 Expedition members look across the arctic sea ice to the *R/V Polarstern*. One wears an expedition jacket that reads 'A Year In the Arctic Ice.' Photo by Julia Zinke, courtesy MOSAiC Expedition/Alfred Wegner Institute 2019.
Then something changed. I’ve written before about the impacts of the COVID-19 pandemic on logistics and crew rotations for the MOSAiC Expedition. And that does indeed complicate the situation. But even in the absence of the COVID-19 pandemic, the ice this year is fragile and especially fast-moving. The possible fragility of the ice has been known for a while. During the planning stages, there was pressure to do the expedition as soon as possible; researchers feared that in the coming years ice in the Arctic wouldn’t be able to support a drift expedition like this. This might be the last chance to set up on-ice research of this magnitude, especially with large equipment fixed to the ice to take measurements 24/7.
The R/V Polarstern and R/V Fedorov entered the ice edge in late September 2019. It quickly became clear that finding an adequate floe of ice was going to be difficult, even more challenging than expected. Even pushing far north into the ice, everything seemed to be thin first year ice or rotten second year ice. Rotten is a term sea ice researchers use to describe ice that is melty and porous either on top, underneath, or both. After many stressful days of searching with ship and helicopter, a floe different than the others was found. One researcher explained how important and improbable this floe was: “It is like finding a hidden treasure.” With a 3-4 meter (9-13 foot) thick ridge of ice running through part of it, the floe quickly earned nicknames like the castle and the ice fortress.
But even in all the excitement, there was concern. The ridge centerpiece was thick, but the outer edges of the floe were a lot thinner. Some of the scientific equipment needed to be set up away from the ridge. The ice here was just thick enough to support the equipment – and likely would grow during the winter. However, there were many questions about how winds and water currents would affect the different parts of the ice. Would the ridge act like a sail, pushing that part of the ice faster than the rest? Would it split apart because of the different forces?
It didn’t take long for this fear to be confirmed. The first big cracks began to form in early October 2019. This was expected. The ice is moving and dynamic. Cracks form, leads develop, and then the ice freezes together again. Researchers were prepared for this. But then on October 23, a larger crack opened up between the ROV (remote-operated vehicle) site and the rest of the floe. The ROV site began to drift away, and a helicopter had to be used to save the equipment.
Back to back storms in mid-November fractured the ice. The entire ice camp shifted dramatically, and the scientific sites were rearranged into a new patchwork. Everyone worked hard to get equipment functioning and connected to power and data cables again. As the cold of polar night settled in, the ice froze back together. The configuration was different, but with lots of hard work, the research on the ice was able to continue. Challenges continued through the winter. Cracks formed. Pressure ridges grew as pieces of ice pushed into and crumbled atop one another. Sometimes, a pressure ridge “swallowed” or “ground up” important research equipment. Lots of repairs and replacements were done. Overall, though, an impressive amount of data was collected.
Then, something surprising happened. The floe started to drift really fast! This spring, there has been a steady weather system that is creating winds that push the Polarstern, the ice camp, and all the ice surrounding it quickly across the Central Arctic Ocean. In an interview with Inside Climate News, atmospheric scientist and expedition co-leader Matt Shupe explained: “"We have this kind of flow regime in the Arctic right now that's been really static," Shupe said. "It's stuck where it is and it's blowing us across the Arctic faster than anticipated, faster than any of the past 12 years that we used in our analysis to figure out where we would go." First this system pushed the floe north, but by April they had crossed as close to the North Pole as they were going to get. Passing within 97 miles of the North Pole, the Polarstern continued it’s transpolar drift. Now that same wind pattern was pushing the Polarstern rapidly south. By early April, the vessel had as far south as it was expected to be in August!
As the vessel continued to drift south, the increased influence of the North Atlantic would become a problem. The ice would likely melting from the underneath, as warmer waters intrude northward. At the same time, the arrival of the midnight sun would create melt ponds on top of the sea ice. This makes the ice more fragile. But rough seas might be a bigger problem than the melting.
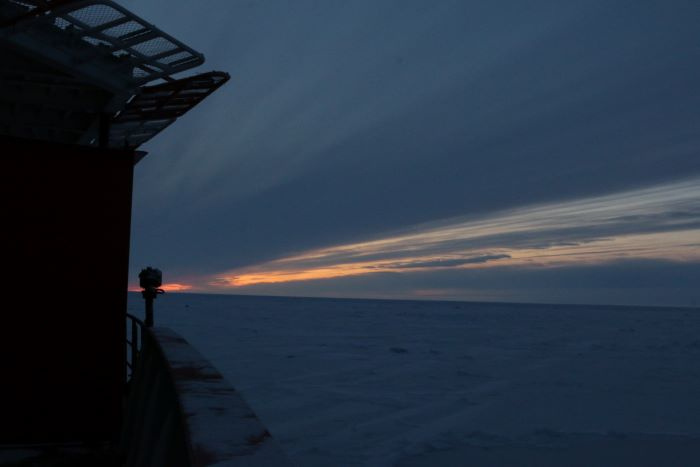
 In late October, the *Fedorov* left the *Polarstern* and headed south. First through thick, highly concentrated sea ice. AS the vessel neared the sea ice, twe encountered a patchwork of thinner ice and began to feel the first rocking from ocean swells.
When there are high concentrations of sea ice – even thin sea ice – the waves and swells of the ocean are muted. You can barely feel them, even in a big storm. But once you near the ice edge, the waves and swells become more significant. As ice concentrations decrease, the power of the ocean affects the ice more. The expedition team feared that, as the Polarstern neared the ice edge in the next few months, swells would bend and stretch the floe breaking it into smaller and smaller pieces.
This problem intertwined with the changing logistics of moving people during the COVID-19 pandemic. There were no icebreakers available due to a combination of factors; in order for the exchange to take place, the Polarstern would have to leave the ice. As of two weeks ago, the plan was for the Polarstern to pack up some of the research equipment and leave the ice. Soon, though, the spring melt will begin. This is one of the most important parts of the seasonal cycle that the researchers were hoping to understand. So, even though the people are headed south to the rendezvous point, the plan was to leave as much autonomous (self-operating) equipment on the ice as possible. This scientific equipment would continue to collect data while the ship and researchers were gone.
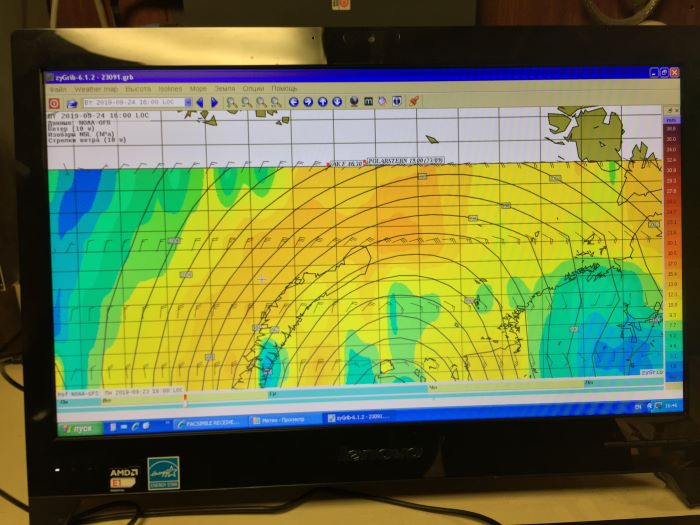
 A screen on the bridge of the Fedorov displayed the wind speed and direction during the first storm we encountered.
Then, around May 12 a major storm blew through. Luckily, the storm was predicted in advance and the researchers chose to move much of the scientific equipment onto the ship as a precaution. Winds hit 9 on the Beaufort Scale, which translates to 47-54 miles per hour or a strong gale. The Beaufort Scale uses the following indicators for this wind speed:
“slate blows from roofs” “some small trees blow over” “high waves whose crests begin to roll over” And “dense [sea] foam is blown along wind direction…large amounts of airborne spray may begin to reduce visibility.”
In the sea ice of the Arctic ocean, there are no trees, slate roofs, waves, or sea foam. There is ice. For them, the indicator of the high winds were cracks that quickly radiated through the ice around the Polarstern.
Examining the situation afterwards, the crew onboard determined it was unsafe to return equipment or people to the ice immediately around the Polarstern. Instead, they turned on the engines of the vessel and motored through channels in the ice to a different part of the floe. From here, they were able to move additional equipment onto the Polarstern.
On Saturday, May 16 ice was pushed away from the Polarstern. They had more data to collect before heading south. The CTD equipment was deployed into the water to measure temperature, salinity, depth and many many other parameters. The CTD also collects water samples from different depths, that are then analyzed in the lab for things like dissolved oxygen, nitrogen, carbon, and chlorophyll. Nets were also dropped into the water – probably to collect plankton, fish, or both (communication from the Polarstern didn’t specify).
Then the Leg 3 team left the floe and began their long-delayed journey home. Some autonomous measuring systems were left on the ice. These will measure atmospheric, snow, ice, and ocean conditions over the next three weeks while the Polarstern is gone. The instruments will also make it easier for the new crew to find the ice camp again.
For Leg 4, it will be a hard race to get back to the ice camp and get some additional equipment installed before the beginning of the spring melt. Better understanding of arctic climate systems hinges on better information about this transition. How do the atmosphere, snow, ice, ocean, and living things interact during this time? What speeds up the spring melt? What slows it down? Is it driven mostly by warmer air temperatures, warmer ocean temperatures, more mixing between ocean or air and ice? What role do melt ponds play? As these ponds form, how much does the meltwater absorb radiation from the sun and speed up further melting? What about the spring bloom of algae in the ice or plankton in the water? Is this just the result of melting and more sunlight, or are the brown and green cells of life part of a feedback loop? Does their darker coloring change the albedo of the ice, meaning more energy from the sun is absorbed?
In order to answer these questions, the Leg 4 team really, really wants to get to what is left of the ice camp before the spring melt truly begins. Hopefully, they will. Chances are, soon afterwards they’ll need to relocate the entire expedition and ice camp to a location farther north. This will allow them to drift through the rest of the summer and ideally some of the fall before the alternate ice camp drifts into the North Atlantic.
 More than 30 buoys with GPS locators were placed on the ice from 10 to 100 kilometers away from the Polarstern when the ice camp and distributed network were first set up. These can help the Leg 4 crew find their way back to the ice camp.
It isn’t exactly how the expedition was planned. Capturing a full year in the lifetime of the same piece of ice was the goal. But by packing up and heading north, they’ll at least be able to document the Arctic sea ice through a year of seasons – even if it is different ice! The Arctic is changing fast, so research plans in the Arctic must also change.
Education Extension
Use data and the map provided by MosaicMonday to track the movement of the Polarstern. Can you identify when and where the ice began to drift more quickly? Which week had the fastest rate of drift?
Check out different versions of the Beaufort Scale such as the one below, which is provided by NOAA. The Beaufort Scale is a great way to collect data at home, without any special equipment. Instead, you make visual observations of things in your environment to record a general wind speed. These observations usually include looking at things in the environment like waves, smoke, trees, or flags, and noticing how they are behaving in the wind. Choose a version of the scale that makes sense for where you will be making observations. Use the Beaufort Scale to make daily observations of wind speed and direction for a week or more. Check out this very cool website for a real-time visual of wind speed and direction around the globe! Compare the winds you observe to the winds experienced in other parts of the world, or the Polarstern’s last location with the ice floe on May 18: North 83.32 degrees, East 8.68 degrees.
 A guide with examples of sea state photographs that can be used to determine the Beaufort Scale for wind. Chart courtesy NOAA.

Add new comment