Sea Ice – August 18th, 2013
The Arctic is a frozen ocean, or sea ice, surrounded by land. This sea ice is constantly changing on a daily basis and is also experiencing long-term climatic changes. In order to understand sea ice, it is helpful to break it down into three areas.
What is Sea Ice?
Tools of the Ice Trade
Tracking Daily Changes
Tracking Long-Term Changes
Sea Ice Importance
Sea ice is very important for polar ecosystems. Sea ice is more porous than freshwater ice because of the existence of brine channels. These brine channels are home to microscopic algae and bacteria, the base of the polar food web. Pack Ice is sea ice that is not attached to the land, and Fast or Landfast Ice is attached to land. The pack ice provides a resting and birthing area for seals and walruses. Mammals such as Arctic foxes and whales forage on the ice, and polar bears hunt on the ice. It also provides a winter home for narwhals.
With more ice in the world, including sea ice, more of the sun's radiation is reflected back into space. This is known as the Albedo Effect. Anyone who lives in Tucson, Arizona experiences this effect daily. That is why more people own white cars, or exercise in white shirts. They absorb less sunlight than darker colors. Here is a picture that really shows the differences in the colors between open ocean water, two different colors of meltwater, and sea ice. Which do you think is going to reflect the most sunlight?
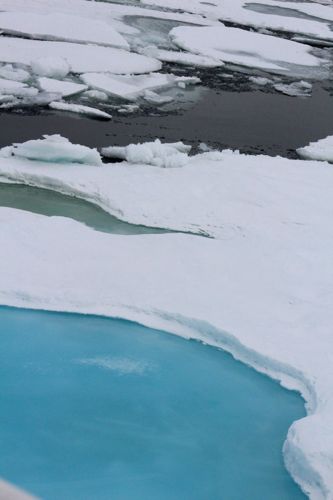 Three different colors of melt pools in sea ice
Types of Sea Ice
Multi-Year Sea Ice is ice that is more than 5 meters thick and stays frozen year-round. The Canadian Inuit call it "qavvaq." The multi-year ice we saw was thicker, it often had dirty spots on it and dark blue ice in it that had melted and refroze.
Multi-Year Ice
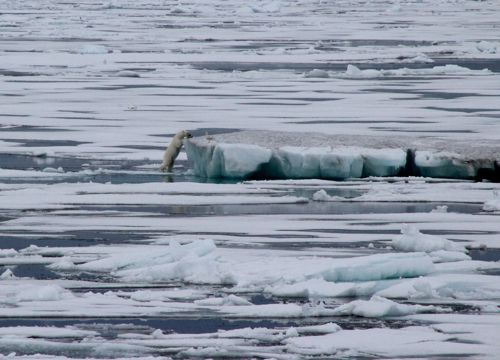 Polar Bear contemplating the top of a piece of multi-year ice.
Annual Sea Ice is ice that is less than 2 meters thick. It forms in the winter and melts in the summer. There are also many different names for different kinds of annual ice depending on its appearance and formation. The best way to understand these is with images.
Annual Sea Ice
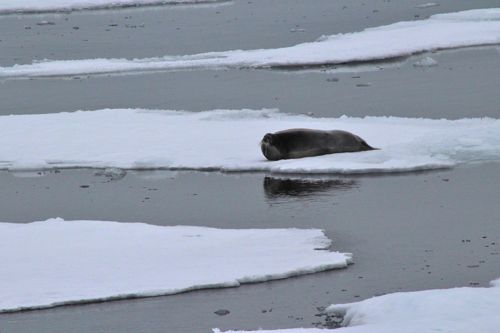 Bearded seal resting on annual ice
Nilas
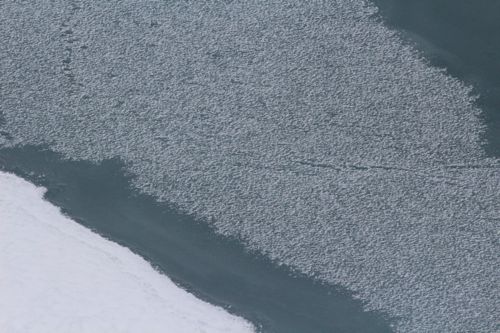 Nilas with fresh snow on top - Smooth, flexible, matte finish, less than or equal to 10cm thick
Grease Ice
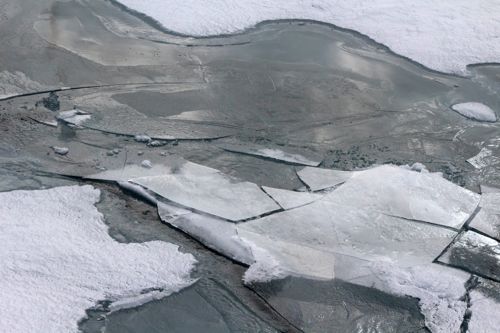 Grease Ice - Notice sheen on water resembling an oil slick
Frazil Ice
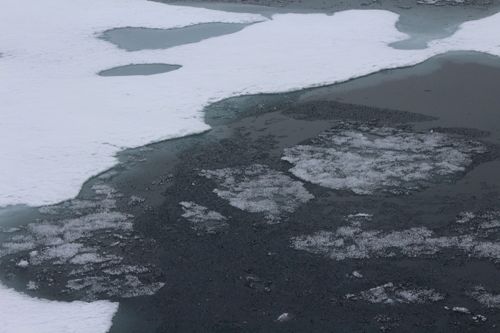 Frazil Ice - Soup suspension of ice crystals (In foreground of photo)
Tools of the Ice Trade
Scientists, navigators, and those people that live in ice areas rely on a variety of tools to track the ice. These include:
- Radar Satellite Images
- Infrared Satellite Images
- Observations from airplanes, ships, and icebreakers
- Traditional knowledge from Native People
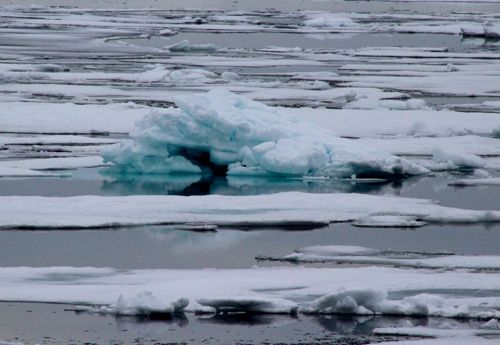 Ice jumbled together showing blue
Daily Ice Changes
Ray Jourdain was an ice captain that was on our ship. He kindly tutored me on the types of ice we were seeing, and on the tools that he used in his jobs. The Canadian Ice Service publishes Daily Ice Charts.
 Ice Chart for Resolute, Canada on 8-Sept-13 (Retrieved from Canadian Ice Service Website)
The colors represent the coverage of the ice in the area. An orange color gives a reading of 7-8/10. This translates to 70-80% of that area outlined is covered in ice interspersed with 20-30% water. The chart also shows "Eggs" with letters. The Egg Code gives more information about concentration, age, and floe size of the ice. Here is a summary of the Egg Code.
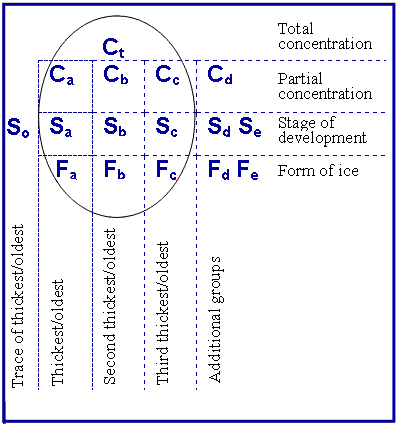 Details about data from Sea Ice Charts (Retrieved from Canadian Ice Service Website)
Long-Term Ice Changes
The National Snow and Ice Data Center is a group in the United States that tracks long-term changes in sea ice. Here is their recent data, and explanations retrieved from their website.
 Map showing Sea Ice Extent in August 2013 (Retrieved from National Snow & Ice Data Center)
"Arctic sea ice extent for August 2013 was 6.09 million square kilometers (2.35 million square miles). The magenta line shows the 1981 to 2010 median extent for that month. The black cross indicates the geographic North Pole."
 Graph comparing August 2013 Sea Ice Extent with previous 5 years and 1981-2010 average. (Retrieved from National Snow & Ice Data Center)
"The graph above shows Arctic sea ice extent as of September 4, 2013, along with daily ice extent data for the previous five years. 2013 is shown in light blue, 2012 in green, 2011 in orange, 2010 in light purple, 2009 in dark blue, and 2008 in dark purple. The gray area around the average line shows the two standard deviation range of the data."
 August Sea Ice Extents for 1979-2013 (Retrieved from National Snow & Ice Data Center)
"Monthly August ice extent for 1979 to 2013 shows a decline of 10.6% per decade."
This has been a quick introduction into sea ice, it's importance, and it's monitoring. My students did many lessons based upon sea ice, and it was incredible for me to be able to observe it in the Arctic.

