The data collected by NASA's Operation IceBridge campaign is distributed to research groups all over the world who are studying the poles to improve models of Earth's changing ice sheets. But how is all of that data collected and what does it look like? Every spring the OIB team heads to the Arctic, where we are right now, in an airborne laboratory equipped with instruments that measure ice thickness and surface topography. The aircraft flies at very low altitudes over sea ice and land ice, covering paths that allow them to measure the same regions year after year and to focus on high priority sea and land ice science objectives. In order to track changes over time, the same paths are flown in the Arctic each spring and over Antarctica each fall.
One of the most essential instruments used to acquire the data described above is the Airborne Topographic Mapper (ATM). The ATM instrument uses a remote sensing method called Light Detection And Ranging (LiDAR) along with GPS and an Inertial Navigation System (INS) to collect a comprehensive data set providing latitude, longitude, and height values for the entire surface region beneath a particular flight path. Kyle Krabill, ATM Team Engineer, supports the data collection from GPS ground station.
How does the Ground Station support this enormous set of data?
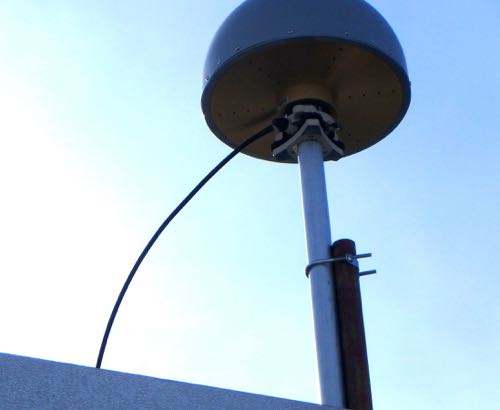
First, a stationary antennae is set up on the roof of a small housing unit over a precisely known location.
 GPS Antenna fixed in a precisely known position above the GPS ground station.
GPS receivers are connected inside the base housing unit and calculate location using a number of U.S. and Russian satellite signals. This location data is then compared to the known coordinates of the antennae and we are able to learn the difference, or error in the satellite data. This difference is applied to the GPS data collected by the moving ATM during science flights in a technique called Differential GPS correction. The ATM data is then published with a 5-10 cm precision.
While there was no science flight today, we headed to the Ground Station at Thule to upload data from a Fairbanks science flight and to check that the antennae held up in the 50 mph winds our Bravo level storm brought yesterday.
 ATM Engineer Kyle Krabill checks on the fixed antenna at the GPS Ground Station Base
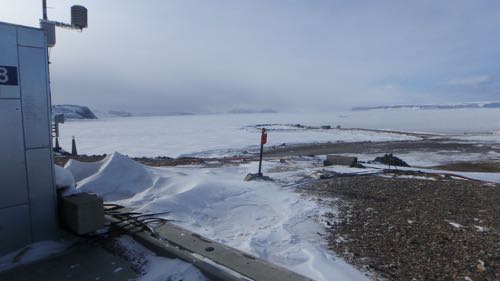
 Frozen North Star Bay behind the GPS Ground Station
During a scheduled science flight, Kyle will run the ground system from one hour before take-off to one hour after touch down in order to watch the trajectory of the satellites before and after the airborne data acquisition is happening.
Question of the DayThe ATM LiDAR uses the speed of light and the time recorded for one packet of light to travel to Earth's surface and reflect back to the plane in order to determine a single range value. This process is performed thousands of times each second in order to collect a continuous line of data points on surface height corresponding to precise GPS coordinates over the science flight track.
Question: If the speed of light is 300,000,000 m/s and the time recorded for one packet of light to travel from the plane to the Earth's surface AND BACK is 3.09 microseconds (0.00000309 seconds), what is the distance from plane to Earth at that point? (Be careful about that value for time! It is a record of the time for the light to get to the ground AND back, so what step must you take to before calculating distance?)
Answer to Friday's QOD: Beaufort Sea, part of the Arctic Ocean! Good Job Cage, Briana, and Caitlin!
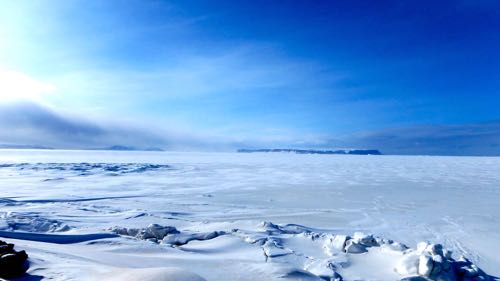
 The bright Arctic sun shines bright over the frozen North Star bay as viewd from the OIB GPS Ground Station
 Part of a routine trip to the GPS Ground Station includes spectacular views of ice bergs and pools of open water scattered about the frozen North Star Bay
Today's Journal Brought to you by the Our Lady of Lourdes Class of 2016!
 OLOL Class of 2016 monitors the GPS Ground Control System.

Comments