Hello, everyone! We will be heading out on science flights soon as the team makes their way back from Fairbanks, later this week. In the meantime, I have had some wonderful opportunities to learn about the big science objectives supported by OIB, as well as some of the instruments that are used thanks to the Operation Ice Bridge Project Scientists and Instrument Engineers. One special experience happening this week is the opportunity to spend time with Dr. Piers Sellers, a NASA Astronaut who has been on three space shuttle flights, lived at the International Space Station, and whose passion for earth science and climate studies is truly inspiring. Dr. Sellers is the Deputy Director of the Sciences and Exploration Directorate and Acting Director of the Earth Sciences Division at NASA/GSFC and I encourage you to read his op ed from the New York Times (which I will link later). I feel beyond honored and privileged to have the opportunity to meet and learn from this incredible group of people.
Today we are going to profile one of the major instruments used by Operation IceBridge. I was able to work with ATM engineer Kyle Krabill and connect with some of the team members in Fairbanks who were more than happy to answer all of my questions. I had fun learning about how it all works, and hopefully this overview does it justice! Ask the Team in the comment boxes below if you have questions!
The Airborne Topographic MapperOn Saturday, we spent time at the OIB GPS Ground Station at Thule which is used to support data collected by the Airborne Topographic Mapper (ATM). The ATM is a laser altimetry instrument on board the OIB aircraft which uses a remote sensing method called LiDAR combined with precise position coordinates to generate a 3D map of the surface of the earth over a given region. We'll take a look today at some of the elements involved in the function of the ATM.
Remote Sensing With LiDAR
Light Detection and Ranging, or LiDAR, is a remote sensing method used to examine the surface of the earth with light in the form of a pulsed laser. LiDAR data is collected in the following way:
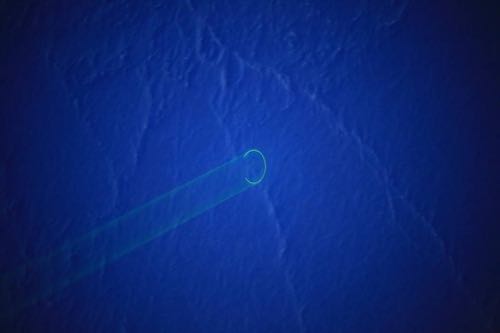
- A laser is pointed at a targeted location on the surface of the earth. In OIB's case the laser is transmitted through a nutating mirror system to create an elliptical "swath" which is the region scanned by the light. The photo below from NASA's Operation IceBridge website allows us to see the elliptical scan over dark morning sea ice during a previous research scan.
 The elliptical scan pattern created by the ATM lidar instrument over sea ice (Photo Credit: NASA/ICEBRIDGE/DMS)
Packets of laser light are generated and fired out of the aircraft one at a time (thousands of times each second).
When each packet of laser light reaches the surface of the ice, it is reflected back to a sensor in the LiDAR instrument.
Time is recorded from the instant each packet is generated until the moment it is reflected back to the instrument.
The time is cut in half and, by plugging the new time and the speed of light into our distance=rate*time equation, the range of the laser is calculated. This range is the one-way distance from the instrument transmitter to the surface of the earth at a particular point.
After the distance from the transmitter to the ground is determined for each pulse of light (remember, this is happening thousands of times each second), the surface height of each point is calculated by taking the difference from the altitude of the aircraft.
An Example
Let's think about the April 23 QOD set up. Say the altitude of the aircraft is exactly 1500 feet (457.3 m) above the known surface level of the Earth. If the time required for a packet of light to reach the ice surface and reflect back to Earth is 3.00 microseconds, we can half that to find a time of 1.5 microseconds. Multiplying by the speed of light, approximately 300,000,000 m/s gives us a laser range (distance) of 450 m. By calculating the difference between the known aircraft altitude (457.3 m) and the measured laser range (450 m), the height of the surface of the ice at that instant is measured as 7.3 m. This will be repeated thousands of times per second and calculations are performed for each laser pulse. Each height value will correspond to a unique latitude and longitude position. This allows scientists to map the surface of the ice.
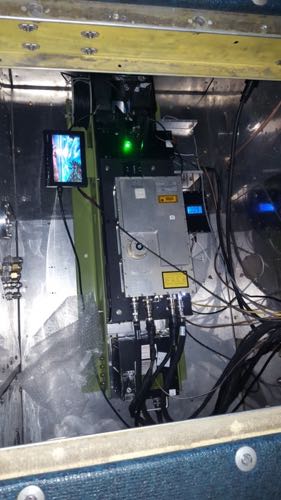
Components of ATM ATM Top View
Transceiver
The Transceiver is part of the ATM installed above a down-facing window, or "nadir port" in the belly of the aircraft. This piece contains the following:
- Green laser-generates pulsed laser light at 532 nm
- Nutating mirror scanning system-creates an elliptical scan
- Telescope-receives the reflected pulses from the ice surface
- Inertial measurement unit (IMU)-a gyroscope stationed on the transceiver to record pitch, roll, and heading.
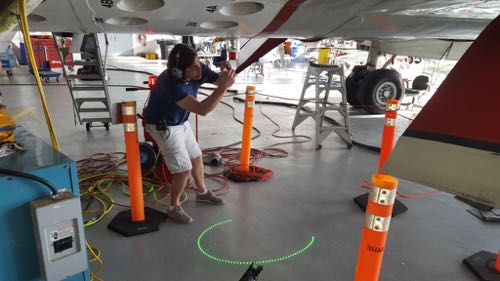
 ATM Team Member Alexey Chibisov testing the lidar with the scan pattern visible on the floor. (Photo Credit: Kyle Krabill/NASA/IceBridge/ATM)
Data System
 ATM Data System
GPS
The GPS receiver is used to find the precise position of the aircraft at any given time relative to the ellipsoid of the earth using latitude, longitude and elevation coordinates. The GPS ground station we visited yesterday supports the airborne GPS data through a method called differential GPS correction. To read more about that, check out the post from April 23!
WFD
The waveform digitizer records the laser pulse as it leaves the instrument and again as it is reflected back. The time of flight between these pulses for each packet of light is then used to calculate range measurements.
Sample Data
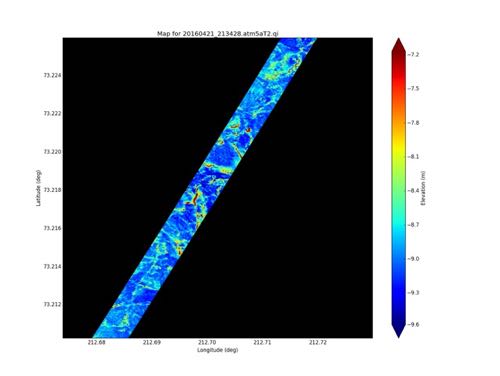
Once the data is collected and processed for each science flight, the team can create three dimensional plots to represent the position and height for the region covered. Below is a sample of ATM data and the corresponding image. This instrument allows us to see the true picture of our earth's surface beyond what is visible to the human eye.
 Preliminary data plot from ATM scan over sea ice. (Credit: James Yungel, NASA; PRELIMINARY DATA NOT FOR SCIENTIFIC USE)
Question of the Day
Using the sample data above, find three latitude/longitude coordinates at which the elevation measurement relative to absolute ground level is between 7.2 m to 7.5 m.


Comments