Today we flew the South Canada Basin sea ice mission. On the map below, you can trace our path which took us through 3 way points: Canada Basin South A (CBSA), Canada Basin South B (CBSB), Canada Basin South C (CBSC) and back to Thule. When mapping sea ice over the Arctic Ocean, flight paths are chosen to cover the largest possible area or region and statistical analysis is used to provide a picture of the overall space. You can see by comparing the SCB path to Tuesday's flight over the North Pole that, while there is little overlap between the two tracks, when combined they cover a large fraction of the Arctic Ocean above Greenland and Canada.
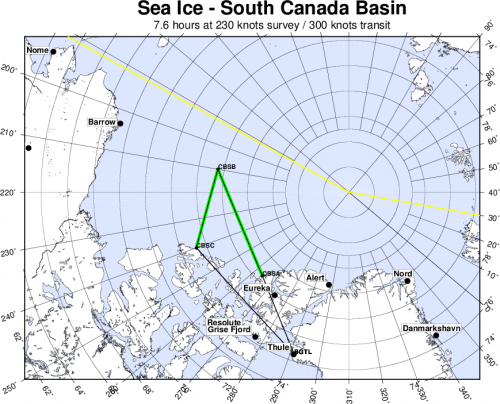
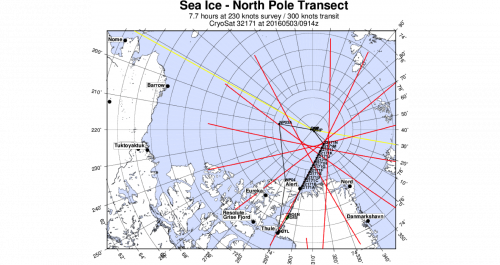
While the North Pole Transect flight was clear and beautiful for data acquisition on Tuesday, we did run into some foggy regions in the western part of our flight today. The optical instruments, which include the Airborne Topographic Mapper (ATM), the FLIR camera, and the Digital Mapping System (DMS) did not collect data through those foggy regions, although radar data was collected.
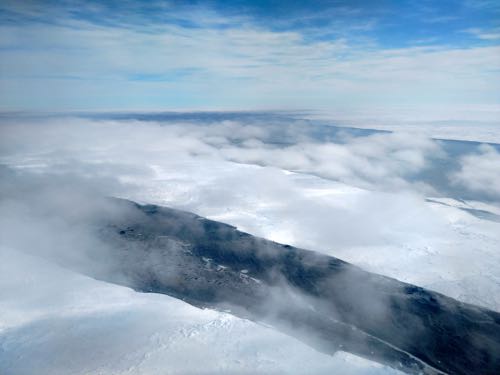
Looking for Leads
Leads, linear fractures revealing open water in the midst of masses of moving sea ice are important to capture during a sea ice science flight. By comparing leads regularly with the ATM data during a science flight, the freeboard of the ice can be calculated which provides the distance of the ice or snow surface above open water.
[image leads]
[image ATM leads]
[image FLIR leads]
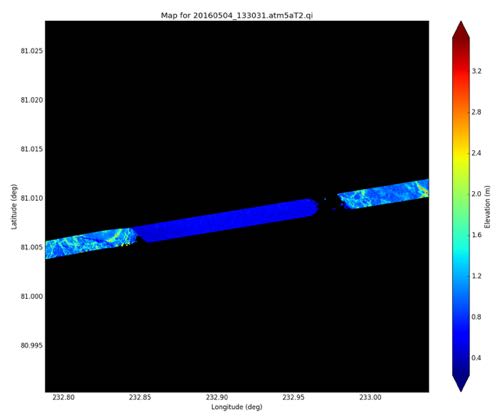
You have seen some of the preliminary data obtained by the ATM LiDAR system. By combining position coordinates with the height above the ellipsoid, a three-dimensional representation of the surface height of sea ice can be calculated from path scanned. When we are flying over bright, thick, snow-covered multi-year ice and quickly come upon a lead which is dark and glassy, the return on the LiDAR data is typically lower. For example, rather than tens of thousands of data points in a small section, there may be 40.

Statistics can still be used in post-processing to achieve the full picture, but in order to maximize the return of elevation data over those leads, the transceiver is adjusted remotely to increase the number of pulses detected over the open water. Take a look at the ATM preliminary images provided by Jim Yungel (ATM) after adjusting power in order to maximize the data points of the leads, shown in dark blue.

In addition to learning about the data acquisition processes on board the P-3, being a part of airborne science fieldwork offers many exciting opportunities for learning. I've been trying to pick up some of the aviation 'lingo' related to weather, visuals, instrumentation, etc. and will lay them out for you in a separate post :). Today was especially exciting in terms of the aviation side for two big reasons:
- I spent take-off and our descent over our target sea ice region in the jump seat of the cockpit. The views left me awestruck, but I also had the opportunity to observe the process of the pilots working cohesively with each other and with the tower to ensure a smooth take-off. Calm, collected, and professional the strong partnership of the pilots in front of me was evident as they moved without a beat from easy conversation to critical decision-making, and back to their story at hand. The experience and skill exhibited by the entire NOAA crew has been evident through every safety drill, briefing, and flight so far.

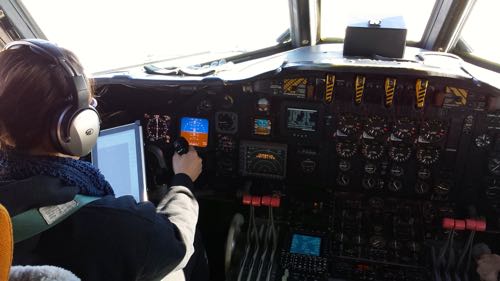
- Near the end of the flight, when data collection was finished and we were cruising 17,000 ft over land ice, I had a chance to fly! I took my temporary spot in the left seat (captain's seat!) buckled in and experienced the view of a lifetime. The view was just icing on the cake because for a few minutes I was learning to fly a NOAA P-3 over the ice sheet! NOAA Pilot and instructor Chris Kerns explained how to use the gauges on the dashboard of the plane to be sure that the nose is exactly where you want it, directed on course and toward the horizon. I used a grease pencil to draw the horizon from my perspective on my window and let that line help guide my control of the plane. While Chris was quick to take back control if I adjusted too abruptly or too far left or right, for a moment in time I was flying a Hurricane Hunter over the ice sheet! That's an experience I'll never forget and I am so thankful to the NOAA crew and pilots for letting me into their world.
# Today's Journal Brought to you by Our Lady of Lourdes Regional Class of 2017!
The average speed during our last flight was 277 knots, or nautical miles per hour. If 1 nautical mile = 1.151 miles, what is that average speed in miles per hour? What is the speed in km/hour?


Comments