Tuesday was "moving day" as we packed our bags, loaded the plane, and prepared to make the trek to Kangerlussuaq, Greenland ("Kanger"). If we were just completing a transit it would take us about 2 hours to make the move. However, it was a beautiful, clear day, and we had a chance to run a science mission along with transit so that is exactly what we did.
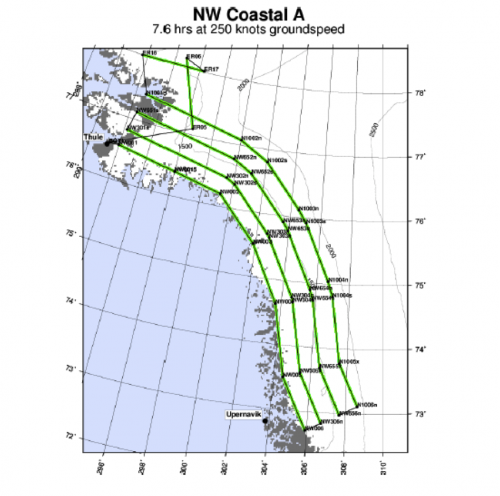 Map of Northwest Coastal Mission en route to Kanger
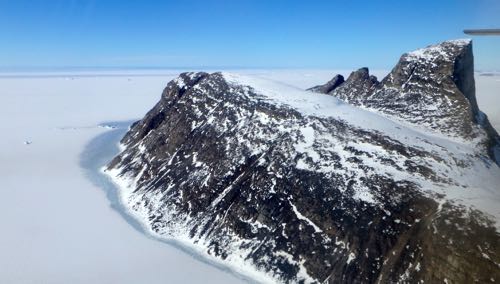 Land ice missions along the coast provide spectacular views of rising terrain along our flight path.
The Northwest Coastal Mission takes us up and down the western coast of Greenland through a series of parallel lines along the coast. These lines are perpendicular to the flow of ice into the ocean and referred to as 'flux gates.' After completing the data collection, we continued the transit into Kanger with our pilots expertly navigating a dense layer of fog and precipitation to land us safely in this small airport settlement. Once we made it through the cloud deck, we had our first look at Kanger, a stark contrast to northern Greenland's Thule. Take a look at the springtime view of Kangerlussuaq below:
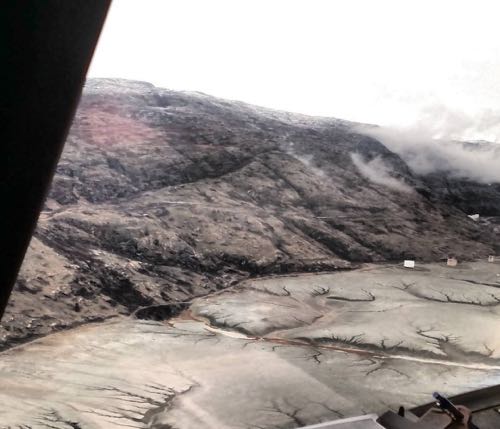 Our First look at Kangerlussuaq as we made it through the cloud deck and touched down in this small airport town.
This will be our second land ice mission since my time with the team here in Greenland began and my 4th science flight in total. While every flight has been different in terms of features and landscape, the captivating beauty is a constant. The physical beauty, however, is just a bonus to (and perhaps a reminder of) the importance of ongoing science and data acquisition happening on board and on the ground. Science flights are busy from start to finish with every instrument team working throughout the flight to take measurements, and ensure the instruments are working correctly. Today I had the chance to work closely with Digital Mapping System (DMS) and got a firsthand account of open network among all instrument teams on board.
An Open NetworkThe Digital Mapping System (DMS) consists of a high resolution camera installed in a nadir (downward-facing) port beneath the plane in addition to two internal GPS systems and an intervalometer used to control the shutter speed. Its swath width is comparable to that of the Airborne Topographic Mapper (ATM) which means it can be directly correlated with some of the LiDAR data. The DMS camera captures images of the target landscape successively during a flight line with about 70% overlap between each shot. After the campaign has wrapped up, all of the images will be processed and a series of high resolution geo-located images are produced.
Part of the data collection process for DMS involves networking with the Airborne Topographic Mapper (ATM) instrument team, particularly the navigation/GPS component of the ATM instrument package. We'll start with a brief overview of the Nav/GPS systemfd:
- The Navigation/GPS system, built by Mission Scientist John Sonntag, is programmed with position coordinates called waypoints (WP) which act as guide markers for the planned science flight route. The system uses GPS data to calculate information about the plane at any given moment including its altitude above ground level, its height above the ellipsoid and latitude and longitude coordinates. The system also calculates time, speed of aircraft, and distance in nautical miles to the next waypoint in order to record accurate information about the position of the plane at any given moment. This is essential for the data collected by all of our instrument teams who are looking at successive data points at precise positions along the priority path of the day. Below is a screenshot of the navigation system during a flight line on the NorthWest Coastal Transect. Key pieces of that section of the screen are labeled to give you an idea of what we are looking at. Those needles are constantly moving as the plane changes position.
The pilots have access to an iPad providing this graphic and each of the instrument teams can access this window on their respective monitors. This is one example of the open network among all operators: any instrument team can access information provided by any other team because as John explained, "The OIB whole is greater than the sum of the OIB parts." Each instrument team is working toward the overall science goals of Operation IceBridge and that drive for the mission is evident in the open collaboration among all team members.
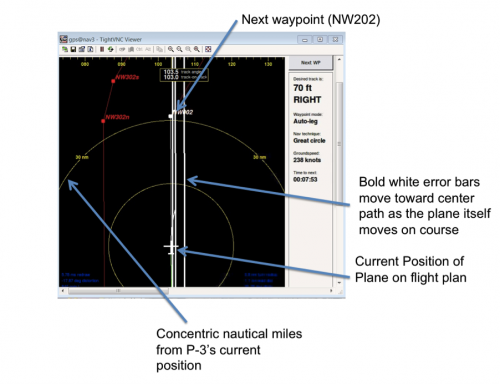 Operation IceBridge Navigation Window
If you find the airplane in the center of the inner circle of the screen, you'll find the representation of the current position of the airplane. A thin white line extends from the position representing the planned course. The bold white lines act as error bars and, as the plane moves closer on the proposed path, we'll watch those bars overlap until they match the thin white line.
The labeled points along the white line in the center and the red line to the left are the waypoints. The red line to the left represents a future flight line along the entire path. The populated values on the right hand side of the image allow operators and pilots to approximate the time until the next waypoint is passed and to view the current ground speed of the plane.
This information is important when monitoring DMS, because each image will eventually be geo-located. During a science flight, the DMS operator monitors that navigation window, and records information about the images captured for each flight line. It is important to record exact times from the navigation window, and starting and ending waypoints for each time period. The internal clock on the camera can drift during a flight, so it is important to record the actual time based on GPS data. Time, along with latitude and longitude, and pitch, roll, and heading of the airplane will help to determine a precise position at any given point.
The operator regularly checks that the camera is collecting images without malfunction, that the shutter-speed is correct for the current groundspeed and altitude, and that any interesting weather events (like strong cloud cover or precipitation) are noted for each flight path. These notes will be useful for analysis of the images in the future.
The actions taken by the DMS operator during a flight are outlined below:
At the beginning of a particular flight line, the speed of the camera is determined using the current ground speed, altitude, and heading of the aircraft.
The camera is switched on and immediately begins capturing images which can be previewed in real time on the DMS monitor.
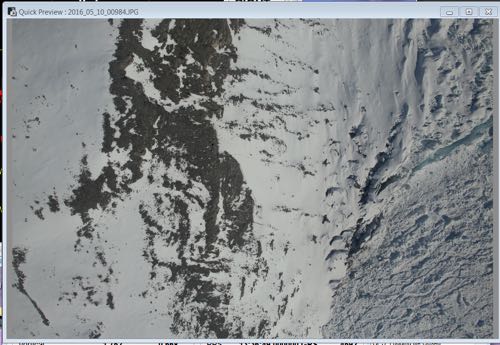 Live preview of Digital Mapping System (DMS) capture allows the operator to monitor data collection throughout the flight.
- A log is kept for each flight line. In said log, the following items are recorded (numbered for reference but not necessarily logged in a particular order):
- Start time of capture
- End time of capture
- Heading of aircraft
- AGL altitude (height above ground level)
- MSL altitude (height above ellipsoid)
- Notes on weather conditions
- Starting and ending Waypoint for flight line captured.
One other item that is regulary monitored is a sky plot, similar to the one shown below which allows operators to see information about the satellites while they are collecting GPS data.
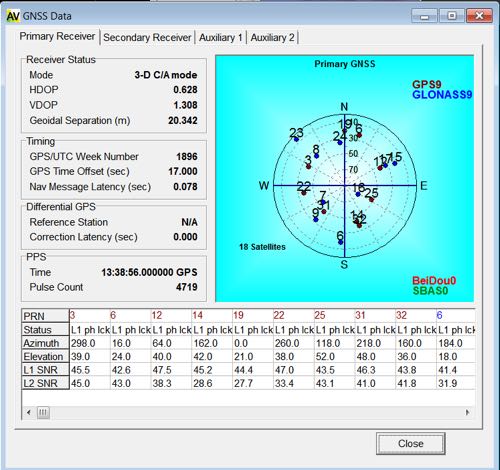 GPS Satellite sky map shows the location of satellites sending position data to the GPS receivers on board the P-3.
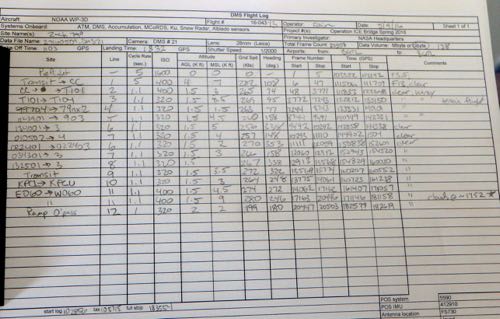 Sample Complete DMS Flight Log from previous day's mission (Zacharaie-79 N)
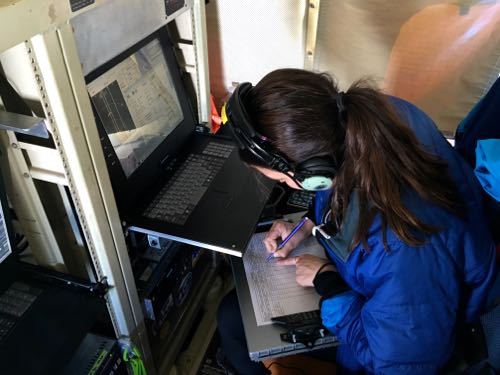 Kelly McCarthy completes a data log for the latest series of imagery collected by the Digital Mapping System during the 7û76665r4sNorthwest Coastal Mission Transect

Comments