Today after our Polar Connect event, we went and completed tram runs and Unispec and NDVI measurements, and began thaw depth on the phenology plots. In a previous entry I explained NDVI (Normalized Difference Vegetation Index) and how it is calculated (see journal entry from June 17th, The Drone Invasion). The day before we did qualitative observations of the phenology plots and today we went back with instruments to collect quantitative data on the greenness of the plants. To do this, we used the GreenSeeker that measures NDVI and the Unispec. The Unispec measures the spectrum of light reflected by the plants from 310-1100 nm. While you can use the results to calculate NDVI, the Unispec data is broader and can be used in other ways. For example, the values can be used to calculate the level of chlorophyll in the plant or its water usage.
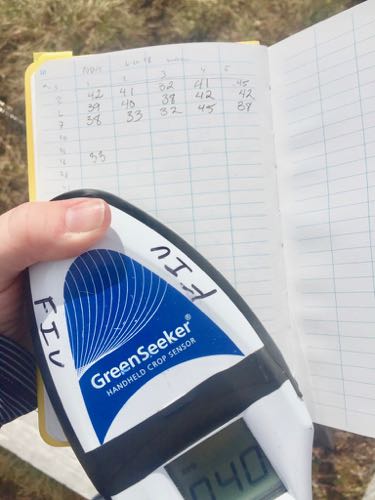
 Recording data in the field book for the phenology plots.
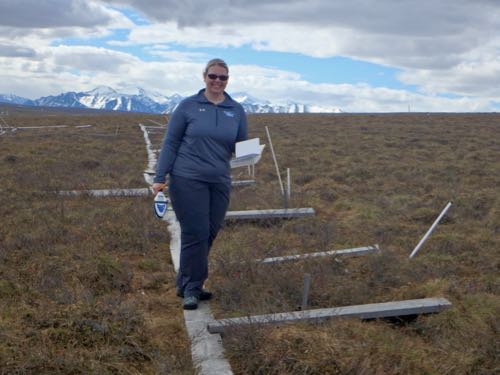
 Melissa Lau takes GreenSeeker Measurements! Photo by Matthew Simon.
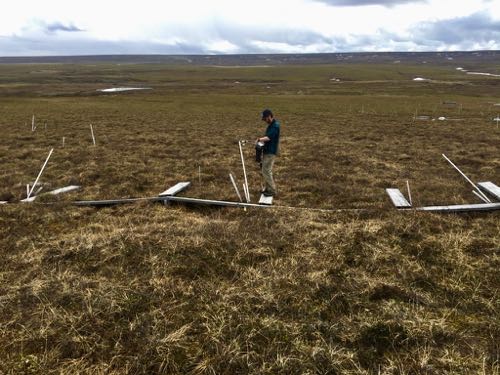
 Matthew Simon uses the Unispec to measure the reflectivity of the plots.
Thaw Depth
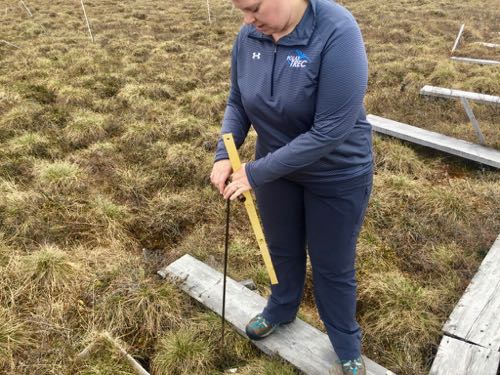
Thaw depth is what it sounds like, how deep is the thawed layer (active layer) of the permafrost. We use a probe to push through to the softening upper layer until we hit solid ice. Then we measure how deep the probe went. Right now, it's not very far. As the summer continues, the active layer will become deeper.
 Measuring the depth of the active layer in the phenology plots. Photo by Matthew Simon.
The Adventures Of Flat Cat
Flat Cat was intrigued by the woolly lousewort at the end of the boardwalk at Imnavait Creek.
 Flat Cat and Pedicularis kanei

Add new comment