Signs of the Times
I flew into the country a few days before the official start of the expedition in order to acclimate myself to the high altitude and to get my legs into shape hiking the steep slopes. The pain I felt radiating from my calves and the ability to hike into town faster, let me know I was making progress.
Along the way I had the opportunity to stop at some tourist stops that also happened to be geologic wonders. I got up close and personal with every rock and outcrop possible, and avidly read each display in an attempt to understand the geology.
I hiked the footpath in Glacier Canyon (Gletscherschlucht) and took the train up to Jungfraujoch (known as the “Top of Europe” with the highest train station in Europe at 11,332 feet). It was very interesting learning how these natural landmarks were formed, but I was even more impressed with the message for future change these displays also expressed.
Graphs, figures, and numbers were prominently displayed showing what these areas looked like in the past, what they look like now, and the potential scenarios for the future.
Discharge measurements of the meltwater at the base of the glacier showed that the maximum rate during the summer months is decreasing over time, indicating a significant decline in the volume of ice.
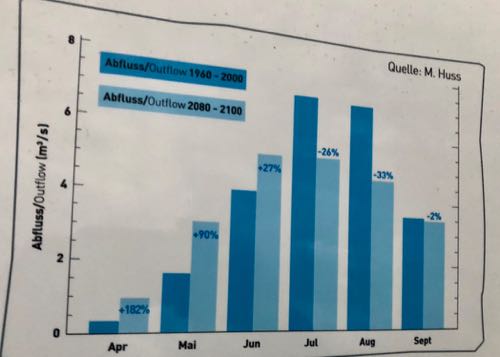 Measured meltwater discharge by month. Past measurements vs. projected values.
Alpine temperature measurements show that there have only been two years with below average temperatures since 1990. All the rest have been above average, with the last couple of years being the highest years above average ever recorded.
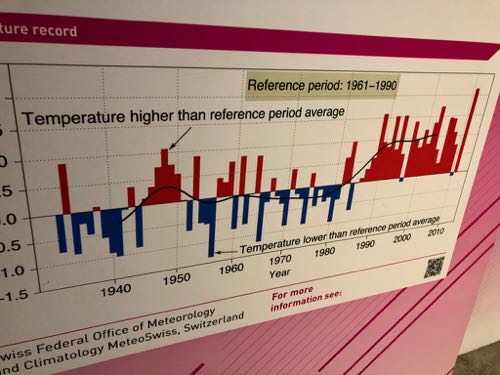 Measured air temperatures plotted against the average temperatures.
Historic photographs taken only 150 years ago show the tongue of the glacier at the edge of the canyon, when it now sits over 2,500 feet in altitude away up in the valley.
 Historic painting of the glacier painting in the 1800's vs. a photograph of the glacier today.
Even more horrifying were the projections showing what the glacier would look like in 50 to 100 years. The answer… it would not look like much since it would be almost completely melted.
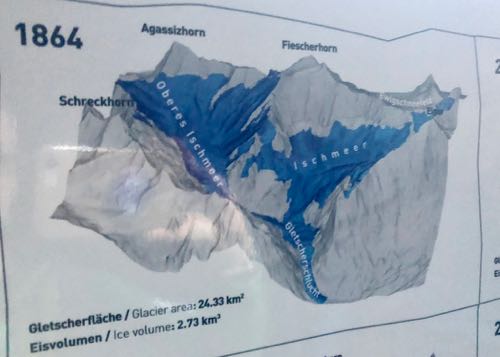 Total ice volume and coverage in 1864.
 Total ice volume and coverage in 2010.
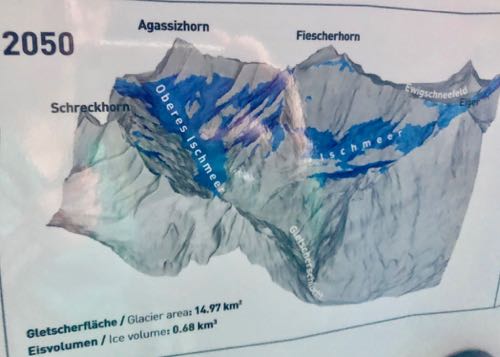 Projected ice volume and coverage in 2050.
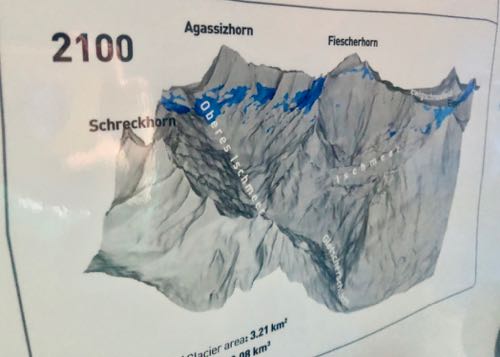 Projected ice volume and coverage in 2100.
There was no tiptoeing around the issue. The dramatic affects of climate change were there for all to see. Our role in all this was also laid bare.
It has been a few decades since I have done a tour of many of the National Parks and natural wonders in the United States, so I cannot attest to whether or not this same type of information is being presented. One can only hope American parks and institutions follow this lead.
PolarTREC Poppy
Poppy and I were so inspired from our visit to Jungfrau that we sat down at lunch on the mountain to write our journal.
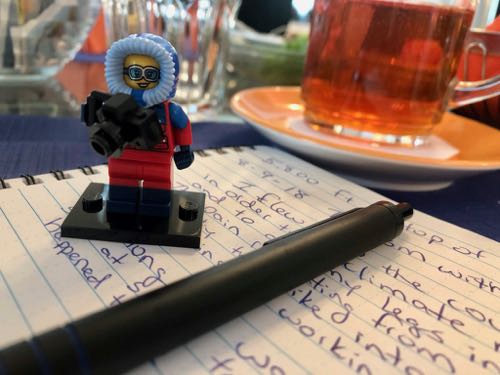 PolarTREC Poppy helping me write my journal at lunch on the mountain.
Daily Haiku
Increasing numbers
More and more red, and less blue
All signs point to this
Photographs from Jungfrau
There were so many amazing sites to see at the “Top of Europe”. Check out this video of my journey up and down the mountain.


Comments
Add new comment