Amundsen, the Geographic South Pole,IGY, and the Clean Air Sector today
Temperature: minus 25 Celsius, minus 14 F Windchill: minus 38.6 Celsius, minus 39.1 Wind: 21 knots **Weather: **snow blown in the air , overcast:
The answer to yesterdays question seems fitting with the date. Amundsen arrived here at the Geographic Pole December 14, 1911. Actually, it also is registered that he came to the correct point of 90 Degrees South on December 16, 1911. However, the plate at the Geographic Pole indicates his arrival here on December 14.
Amundsen and Scott’s arrival at South Pole
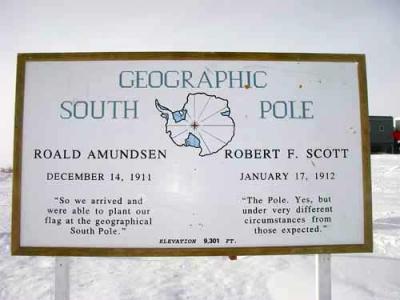 This is the plate that honors the effort of both: Amundsen and Scott . Scott arrived at the Geographic Pole 4 weeks later than Amundsen.*
Elke at the Geographic Pole
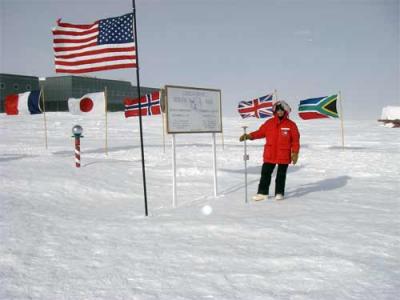 Elke holding the pole that designates 90 degrees South.*
Each year the actual pole at 90 degrees south receives a special knob. This year, Jan 1st , 2007 it was designated in honor of the 50 years of the International Geophysical year, conducted in 1957. This was the first international effort to collect scientific data collectively in Antarctica.
The knob at the Pole
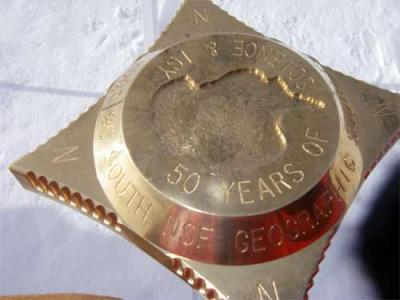 In honor of the IGY, 1957*
Answer to yesterday’s question: What is the difference between the Ceremonial and the Geographic Pole?
The Geographic Pole designates the exact point at 90 degrees South. Since the ice mass of the plateau moves, this pole has to be corrected every year. This is done on January 1st of the year. I will be here for the January 1st, 2008 Geographic Pole correction ceremony.
The Ceremonial Pole, on the other hand, is designated in honor of the 12 countries who signed the Antarctic Treaty in December of 1959. The Antarctic Treaty protects the Antarctic continent. It was agreed that this continent shall not be owned by anybody and that it shall only be used for science in a peaceful way. It was signed for 90 years and I hope it will be able to be renewed in 2041 !
The Ceremonial Pole
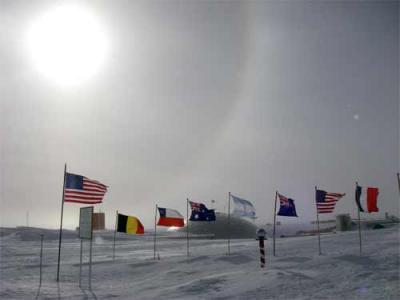 Next to the Geographic pole: The Ceremonial Pole: the glass ball and some of the flags of the 12 countries that signed the Antarctic Treaty.*
During early afternoon I had a chance to visit the "Dark Sector” of the station Helmut Spieler from Berkeley University gave me a tour of the larges telescope in the world that will be able to detect cosmic background energy. Stay tuned for the report at a later date!!
Question: What is the "Dark Sector”?
As I walked over from the "Dark Sector” to ARO to learn from Andy about how we detect and analyze gases at the Clean Air Facility, I thought of all the advances we have made since the IGY in 1957,
One of the scientists during the IGY was Keeling who worked in 1957 at the first South Pole station. He started to collect the carbon dioxide data. NOAA has continued to collect this data since.
How do we monitor the gases in the air and assure quality of the samples? The NOAA team is certainly expert to do this all year around.
First, ARO , the Atmospheric Research Observatory is further away from the station.
Second, ARO is next to the Clean Air Sector, the area that, without permission, no one can enter and no plane can fly over.
This assures that the air samples are as the cleanest in the world!
How doe we sample for carbon dioxide?
Air samples are taken via a line from outside and the gases measured.
Carbon Dioxide intake
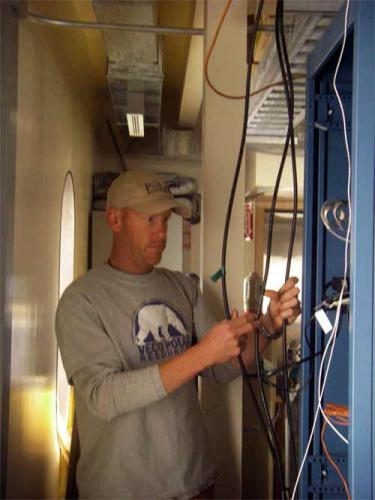 Andy is holding the line that leads to the Clean Air Sector outside of ARO that will take in the air for CO2 measurements.
A sample from the Monitor is taken in a bottle for testing in Boulder in the lab, as a control
Air collected in a bottle!
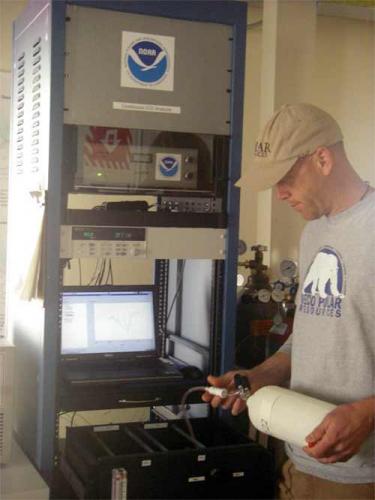 Andy is collecting air in these bottles for carbon dioxide analysis.
CO2 Bottle
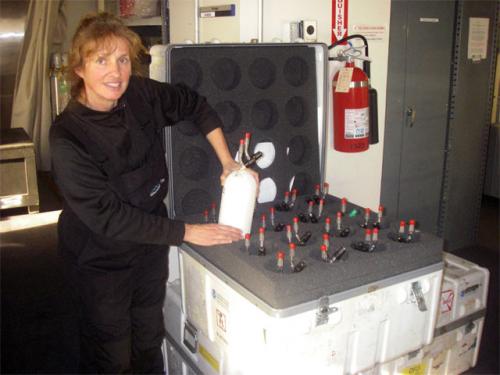 Elke is placing a CO2 bottle in a container to be send for control testing to Boulder.*
The container has a warning sign that it should not be frozen and should not be kept for long on the ice.
Do not Freeze
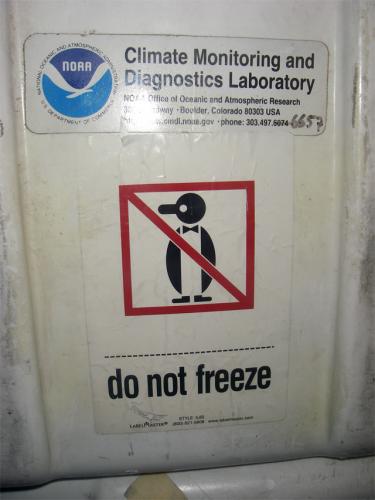 Containers with this sign must not be standing on the ice for very long!*
The data collected and recorded from all monitors at ARO need to be constantly compiled on the computer. Andy is working on the computer that collects all the data files; on the wall is the famous CO2 curve from the different stations of NOAA, including South Pole. CO2 concentrations are rising everywhere.
Andy the computer expert!
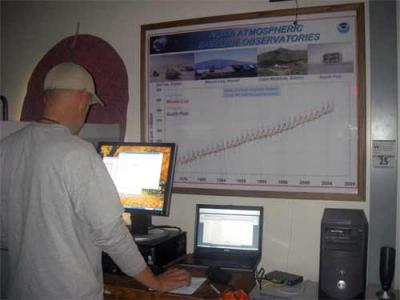 Andy is working on the computer that collects all the data files; on the wall is the famous CO2 curve from the different stations of NOAA, including South Pole. CO2 concentrations are rising everywhere.*
Mr. Keeling started to record Carbon dioxide at the South Pole in 1957, during the International Geophysical Year.
50 years of data collection
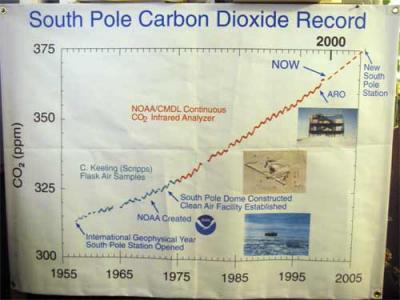 This graph includes all CO2 data records. Mr. Keeling started to record Carbon dioxide at the South Pole in 1957, during the International Geophysical Year.*
As I passed the Poles and walked back to the station from ARO, my thoughts drifted back to the pioneer Amundsen: How much we have achieved since Amundsen arrived here at the pole; in particular in the past 50 years, since 1957 when scientists collected data here at the South Pole as part of the International Geophysical Year. I turned around and saw this magnificent picture. I was in absolute awe of the beautiful halo I saw and grateful for the time I could spend here at the Pole. With all the progress we have made in science, I thought, the sight of such natural beauty will still remain essential for soothing our souls.
The Poles and ARO
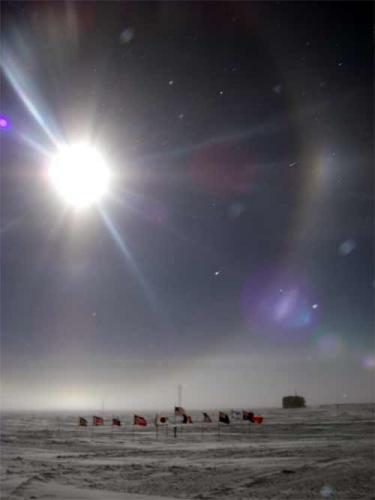 Walking over from the new station to ARO, I pass the Geographic and the Ceremonial pole. ARO is in the background, about 1/4 of a mile away with a magnificent halo.

