Collaboration
I feel very fortunate that I have the opportunity to work with a number of different research labs during this cruise. Scientists from the University of Rhode Island (URI), Old Dominion University (ODU), the University of South Florida (UFSF) and the Woods Hole Oceanographic Institution (WHOI) are working collaboratively in an effort to collect as much data as possible during our time in the Southern Ocean and near the Western Antarctic Peninsula. In addition to the lab Principal Investigator (PI), each research lab has a number of different graduate students and technicians that focus on various aspects of the research. Over the course of our cruise, I hope to shadow each scientist to learn more about their role in this collaboration. Judging by the amount of specialized equipment and designated lab areas, I should have plenty to journal about. This will truly be an eye opening experience to learn more about how the physical, chemical and biological science worlds unite to answer questions about our oceans.
Duty Calls
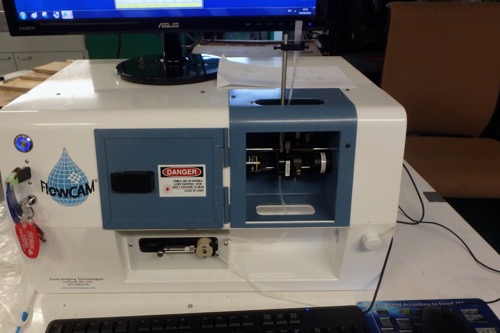
Being surrounded by experts can be a bit intimidating, however, I am always up for learning new techniques and new concepts. Today, I had the opportunity to work with URI graduate student Kris Gomes while he assembled an instrument called the FlowCam from Fluid Imaging Technologies, Inc. This dynamic imaging particle analysis instrument allows scientists to look at live, microscopic samples in real-time. This was also an opportunity to train with the equipment. Working with the FlowCam may be one of my specific duties during the cruise, therefore, it is important to start learning the specifics about the machine as soon as possible.
 URI graduate student Kris Gomes works in the NBP Hydro Lab to complete test runs on the FlowCam system. Kris will spend time imaging water samples from the Southern Ocean. These samples will come from the tubes running along the back wall.
 The FlowCam Dynamic Imaging Particle Analysis system is a live imaging technology that houses a computer system, microscope and camera in one compact unit. The computer component allows scientists to adjust many details including flow rate and image capture parameters in addition to analyzing data using graphs, queries and other tools.
An Overview Of How It Works
The FlowCam works by suctioning ocean water through a small, hollow glass tube called a flow cell. This flow cell works in the same way a microscope slide works on a light microscope. When using a light microscope, a single liquid sample sits on the glass slide so that light can pass through the microscopic objects. This light then passes through a series of lenses that help to magnify the objects already on the slide. The flow cell also allows light to pass through to the lenses, but it allows larger sample sizes to flow past the lens. With the help of the computer software, Kris and other scientists that use the FlowCam can continuously view large quantities of live samples instead of creating microscope slides over and over again.
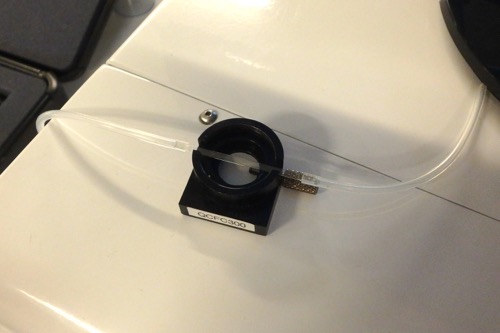
 The thin, glass tubing (known as a flow cell) is carefully placed into a holder that mounts onto the computer. Water samples move through the flow cell at a predetermined rate. The computer can then capture images of organisms in the water
 The flow cell is now secure and ready to hold water samples. Light passes through the flow cell from a light source on the right of the image. To the left of the flow cell, an objective lens magnifies the organisms that pass through the flow cam.
Visual Data - Images
One of the true advantages of the FlowCam (in my opinion) is the opportunity to analyze data within minutes of collecting the sample. Scientists can look at the size of the organisms in the sample, they can filter out other images that have a similar shape, a similar size or those that may fluoresce when exposed to the same wavelength of light. This type of analysis is useful in identifying specific species of microorganisms, analyzing size ratios of microorganisms in a specific location or comparing specific characteristics of species within similar populations.
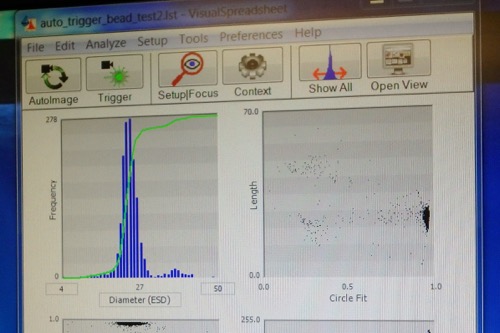
 This computer read-out shows images of focus beads that just passed by the objective lens. These small glass beads allow the user to adjust the focus and position of the flow cell before ocean water samples are placed in the machine. During the cruise, this screen will contain images of live diatoms and other microscopic organisms from the Southern Ocean. We can see the diatoms that are in the water at that exact location in real time.
Visual Data - Graphs
Whether your state follows the new Next Generation Science Standards (NGSS) or a modified version of the standards, students are tasked with learning skills relevant to Science and Engineering Practices Mastering skills including analyzing and interpreting data, constructing explanations and communicating information are encouraged as students progress through school. One way to master these skills is to practice creating visual data in the form of tables and graphs. Typically, students create graphs as a final product for a lab report or presentation. Although this type of graph is important, Kris Gomes is also quick to point out that graphing your data is not always the last step. In many cases, says Kris, it is a way to make decisions about the next step in your work. For example, Kris will begin analyzing ocean sample on the FlowCam using wide flow cells that allow many different sized organisms to pass by the objective lens. After running samples in this large flow cell, Kris can use the software to visualize the distribution of species size to make determinations about what flow cell to use to in his next round of analysis. Kris can continue to monitor changes in species size by graphing data throughout the sampling process. He can also monitor changes in shape or other characteristics using this vital scientist tool.
 The FlowCam unit can present data in the form of graphs. The graph on the left shows the average size of the focus beads. As you can see, most of the beads are the same size. During the cruise, the computer can provide readings on the average size of the live diatoms in the sample. These graphs can help scientists make on-to-spot decisions about sampling protocols.
TMC Bubble Update
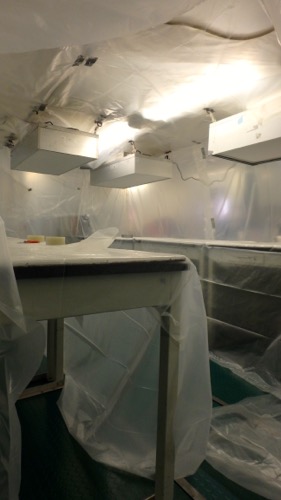
Progress continued on the Trace Metal Clean (TMC) bubble discussed in yesterday's journal Today's tasks consisted of sealing the openings of the plastic cover using polyethylene tape, covering all inner surfaces with plastic and turning on the filters to create positive pressure inside the bubble. The HEPA filters draw air in from outside the bubble, filter the air and then force the air out of an opening. With the introduction of positive pressure, the plastic covering expands just like a balloon. A small doorway will be created to ensure that the air can escape, but that the TMC bubble remains a clean environment. I look forward to my day(s) of shadowing the chemists in the TMC bubble to learn more about their clean techniques and analyses.
 The HEPA filters are installed and begin filtering small particles from the air to create a clean space for the trace metal scientists.
 Once the HEPA filters are running, the air flow and change in pressure cause the plastic to expand and create a real bubble around the lab area.
Question For Journal Readers
The FlowCam described in this journal is very similar to what type of equipment used in a high school biology classroom? Please provide the specific instrument name when you answer. Leave your answer below in the comment section.


Comments