Science Update
Today was a long day! Yesterday's powerful winds made it difficult to sample, so we delayed the start of Incubation 2 until today. Incubation sampling requires three full casts of the trace metal rosette, followed by time to fill bottles and transfer everything to the incubation van. To learn more about the incubation experiment set-up, read this Incubation Sampling Day 1 journal from September 14th.
Layers
The ocean can respond to many changes including the gain and loss of heat, the freezing and thawing of ice, and the movement of water due to winds. These changes can affect different characteristics of the water and help to create a layered system. Two factors that oceanographers study to learn more about the water are temperature and salinity (or the concentration of dissolved salts in the water). Measurements of the temperature and salinity of the water can be used to calculate the density of the water. If temperature decreases or salinity increases, the density of the water increases. If the density of the water is different at various depths, layers are created in the water column. These layers can cause circulation of the water, called thermohaline circulation. This circulation can help to mix nutrients into the surface ocean and create areas of productivity in the ocean.
Conductivity, Temperature and Depth (CTD)
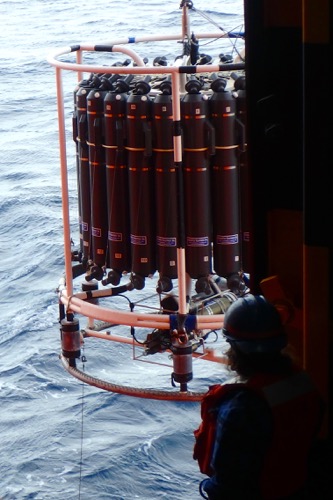
Oceanographers have developed CTDs to determine the vertical profiles of temperature and salinity. Early sampling methods including individual bottles attached to line at certain length intervals. The bottles were lowered into the water column and a weight was used to trigger the bottles to close. This allowed for only one water sample to be collected at each depth. In the 1980s, Neil Brown of the Woods Hole Oceanographic Institution (WHOI) developed technology referred to as a CTD. The CTD is used to continuously determine the temperature, salinity and depth as the machine moves through the water column. The CTD can be deployed on its own, but is often mounted on a rosette that also holds water sampling bottles. In the image below, the CTD sensors are housed in the greenish color tube at the bottom of the rosette.
 The conventional rosette holds 24 Nisken bottles and a CTD sensor. The CTD sensor housing can be seen just to the left of the Marine Technicians hard hat. The CTD housing is green in color and laying horizontally across the bottom of the rosette.
Data from the CTD travels over a conducting wire cable to a computer aboard the research ship. Data is projected onto a computer monitor for scientists to view in real-time. Decisions regarding where to collect water samples can be made by looking for mixed layers or other significant changes in the water column. A mixed layer is a region where wind mixes the top layers of the ocean. This layer is distinct from the deep ocean. Each bottle can collect a water sample using a click of the computer mouse. If the rosette holds 24 bottles, then 24 different samples can be collected. Or, scientists may choose to collect 3 samples at each depth, or some other combination.
 Electronics technicians (ETs) control the computer operations for the CTD sensor. Data, including temperature, salinity, and depth are shown in real time on the computer monitor.
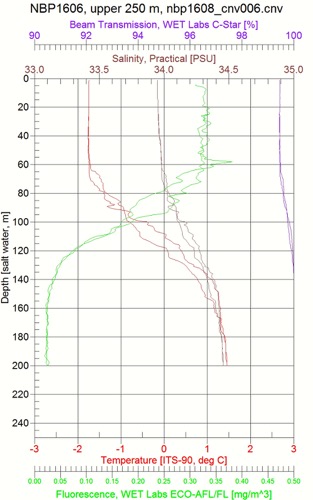
More than 40 CTD deployments, or casts have been completed on this research cruise (so far). The image below shows data produced from one of these casts. The red line indicates the temperature of the water and the brown line indicates the salinity of the water. You will notice that the temperature and density change very little in the upper surface of the water column (above 60m). This area of uniformity is the mixed layer. With the high winds and rough seas that we have experienced in this area, the mixed layer can sometimes extend much farther into the water column as the waves churn up the ocean and cause mixing. This can create challenges for phytoplankton due to light limitation, but we will discuss that in another journal.
 Data from the CTD is available in real-time and can be saved for future viewing.
One interesting note to point out on the CTD data from the cruise has to do with the temperature. In most parts of the temperate oceans, temperature decreases with depth. If you have ever been swimming in a lake, you may have experienced the colder waters as you go deeper into the lake. The same is generally true in the ocean. You may notice, however, that the red line in the image moves towards the right as the depth increases. This means that the water temperature is actually increasing as you move deeper into the water column. Why? The surface temperature combined with cold freshwater from ice sources help to make the surface of the water colder than the deeper portions. This is not surprising to scientists that study the Southern Ocean, but it was surprising to me when I first starting watching some of the CTD casts.
Multi-purpose Equipment
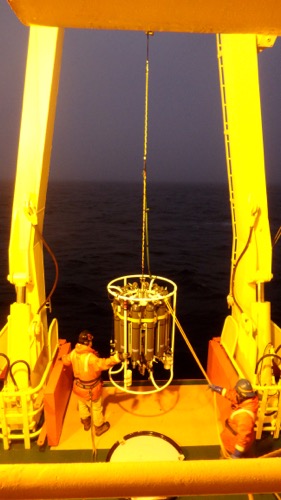
CTD sensors can also be equipped with sensors for oxygen, nutrients, sound velocity, light transmission, and water transparency. The ability to add additional sensors to the CTD allows scientists to study various aspects of the water column with a single deployment of the CTD. The CTD rosette is deployed off the side of the research ship using cranes.
 The CTD can be deployed from the RVIB Palmer at any time of day. This cast was done in the evening using the large on-deck lights, which created an orange glow.

Comments