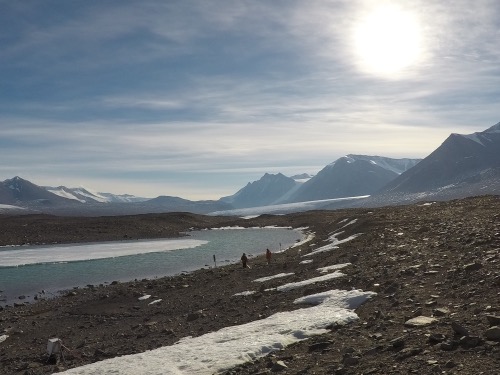
Yesterday we sampled the P3 Experiment and today I wanted to explain more about it. The P3 is a large manipulative experiment to simulate a permafrost melting event. The experiment is set up on a hillside above Many Glaciers Pond.
 Matt Hedin and Andy Thompson stand next to Many Glaciers Pond in Taylor Valley while sampling the P3 Experiment.
P3 Experimental Design
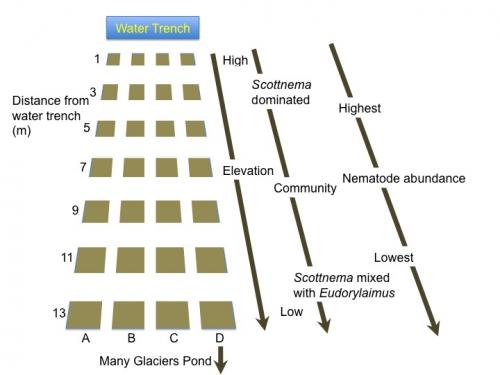
The experiment has three treatment blocks: a control block, a high-frequency water input block and a low-frequency water input block. There is a trench for adding water at the top of each block. Each block is broken into four rows of 1 m2 sampling plots. There are 14 plots per row and every other plot is sampled.
 This is a schematic of the layout for one block of the P3 experiment. There are three separate blocks with different treatment frequencies.
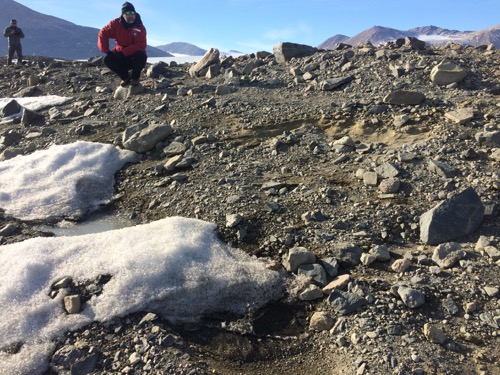
Each year the high-frequency block is treated by adding 400 gallons of water and the low-frequency block is treated every other year. This year nature decided to manipulate the experiment for us. Temperatures have been slightly colder than normal and there has been a higher than normal snow pack. The snow is still covering some of the plots and the trenches where the water is added for the treatments. One of the trenches had standing water in it like it would if it had just been treated. The decision was made to sample but not treat the experiment this year and return to the normal watering schedule next year. One of the difficulties of field work is adjusting to the unpredictability of the natural environment. Weather events can necessitate modifications to your experimental design and often they add a layer of complexity that must be accounted for in your data analysis. This is a problem faced in all environments and not just the Antarctic Dry Valleys.
 Jeb Barrett surveys a snow covered experiment in Taylor Valley. The large amount of snow prohibited adding a water treatment to the experiment in 2017.
Sampling Procedure
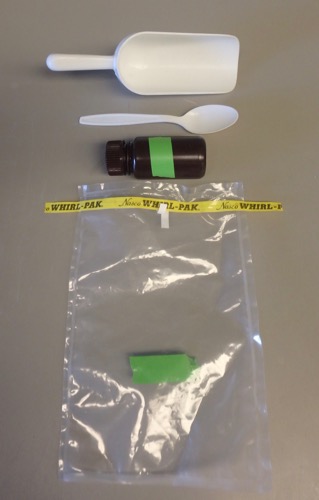
In each of the experiments, including the P3 experiment, the sampling procedure is basically the same. We have a sample kit that consists of a Whirl-Pak® bag, plastic scoop, plastic spoon and an amber bottle.
 This is a typical sampling kit for soil experiments in the Dry Valleys.
The spoon is first used to scrape off the top few millimeters of soil in an area the size of a pancake. That top layer of soil goes into the amber bottle and it will be tested for chlorophyll back in the lab. Then the scoop is used to collect 400-500 grams of soil to a depth of 10 cm. The soil is placed in the Whirl-Pak® bag. The whole process only takes a couple of minutes but there are often lots of samples to take and you have to work slowly to avoid sampling in the wrong place or trampling an experimental plot. One misplaced footstep or incorrect treatment can do permanent damage to a soil experiment in the Dry Valleys.


Comments
Add new comment