Cruise Day 52
Speed 1.5 knots (kts)
Course 242° (WSW)
Location Canada Basin, ~250 nm north of Barrow, Alaska
Depth 3894 m
GO DEEPER DISCUSSION: (see previous journal for the questions.)
Barometric pressure (also known as air pressure or atmospheric pressure) at sea level is primarily influenced by two variables, temperature and humidity. Increasing temperature and/or humidity causes the density of air to decrease, lowering the air pressure. Both heat and water vapor are essentially fuel for storms, so rapidly dropping pressure often indicates stormy weather on the way. Additionally, when there is a rapid change in barometric pressure it is likely to be windy, as air wants to go from higher to lower pressure areas. Simply put, the stronger the gradient (difference in pressure per unit distance), the stronger the wind.
TODAY’S JOURNAL:
We settled in to our next super sampling station in the wee hours of the morning, hoping to get crossover measurements to compare with a Canadian GEOTRACES team’s results at these coordinates a few weeks ago. If you recall, we also did a crossover station near the North Pole that was repeated by the German GEOTRACES team aboard Polarstern. The forecast winds peaked last night at 30+ knots, which got a bit of a sea up. Luckily, the Healy rides pretty well and we haven’t been too tossed about while we sit here on station. Actually, “sitting on station” is a bit misleading in the windy conditions – we are currently drifting at about 1.5 knots over the sea floor, Healy’s large bluff side acting like a giant sail as it catches the wind. This created problems on our deep GEOTRACES cast, as the rosette played out well behind and to the port of the aft A-frame. We may have to try the cast again – for now I’m on standby. When I went out to get the cast in, it was snowing quite hard. The Coast Guard deck crew and scientists working the cast shoveled the fantail so we didn’t have to slog through the accumulated wet snow. But by sunrise the clouds had cleared revealing a brilliant blue sky and sparkling crests on the galloping Arctic Ocean waves. The combination of getting farther south and plenty of open water seems a little more bird-friendly, as a gang of five glaucous gulls kept tabs on the Healy on and off around mid-day.
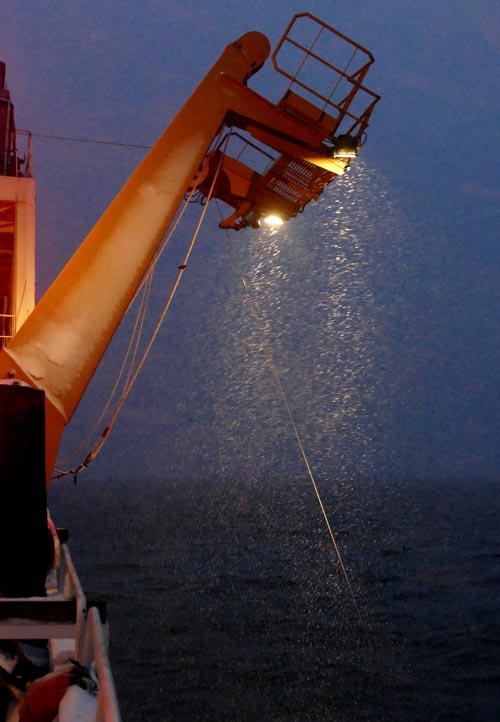 Heavy snow swirls in the lights of the starboard A-frame early this morning.
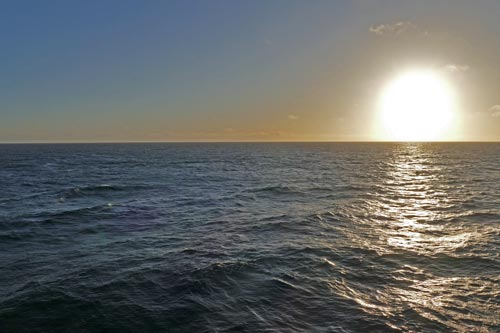 By sunrise the skies had cleared and the sun lit an active ocean.
I had a nice tour of the carbon van yesterday, hosted by Ryan Woosley, Assistant Scientist at the University of Miami, Florida. Ryan, along with Fen Hauang and Andrew Margolin, are measuring inorganic carbon in the seawater samples we are collecting. Inorganic carbon centers around carbon dioxide (CO2), along with other related compounds that carbon dioxide can change into after it is dissolved in seawater. The oceans hold approximately 50 times the carbon dioxide as our atmosphere does, and the team is looking at how much CO2 goes into he ocean and how it is affecting ocean systems. To do this, the team is trying to quantify four primary variables. Their lab space is in a science van on the “porch” just forward of the science berthing deck. They have a short commute from their rooms to get there, but a fairly long walk from the starboard staging bay next to the main lab where their samples are retrieved.
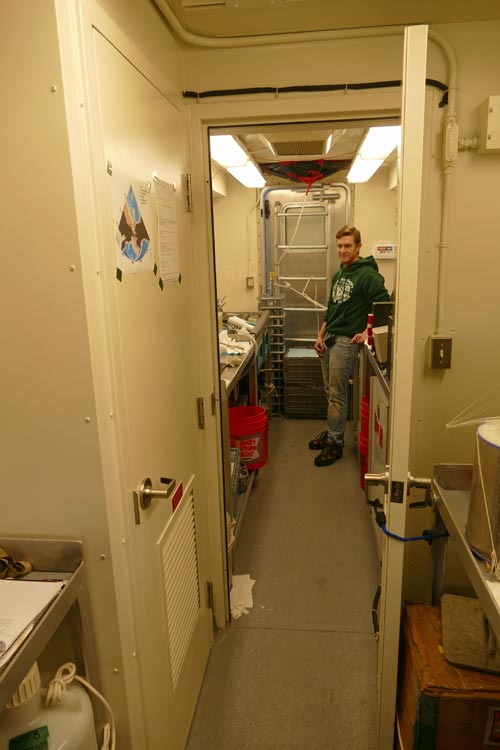 Ryan Woosley welcomes me to the carbon van.
The first measurement that a sample undergoes in the carbon van is the high-resolution pH determination. After calibrating with a blank sample, an automated system injects precise amounts of a purple-colored indicator into a stream of sample water that enters an Ultraviolet Spectrophotometer. This device measures the strength of two color evolutions in the indicator, one yellow and one purple. Each shows up as a peak when the color outputs are graphed, and by comparing the peaks to each other the precision pH value is calculated. Implications of pH are significant, with ocean acidification resulting from extra CO2 being absorbed into seawater, creating carbonic acid. The Arctic Ocean is particularly susceptible to ocean acidification, due to its low alkalinity (ability to buffer acids) and cold temperatures (CO2 becomes more soluble in water as the temperature drops.)
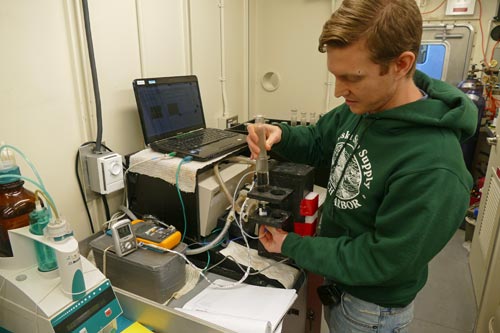 Ryan determining a sample’s pH using an Ultraviolet Spectrophotometer.
Speaking of alkalinity, that is the next measurement that the carbon team makes with water from each depth sampled. The two primary molecules that influence seawater alkalinity are bicarbonate and carbonate ions. Another automated system performs an acid titration, gradually adding tiny amounts hydrochloric acid to the sample while monitoring the pH. During this analysis the samples are kept at a constant 25°C by immersion in a circulating temperature-controlled water bath. A sample will stay buffered until first the bicarbonate is all reacted, causing a small drop in pH. The pH will level off again as carbonate buffers the sample, and when the pH begins to drop once more the system calculates the overall alkalinity based on how much acid the sample could buffer.
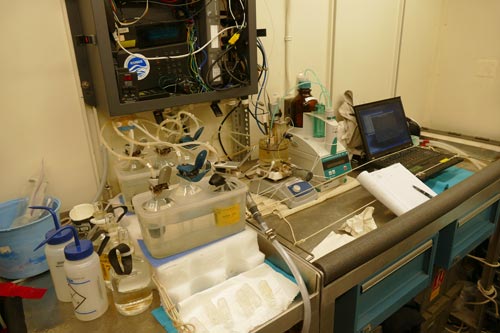 This is the automated total alkalinity system used by the carbon team.
The total inorganic carbon value is determined by a third automated testing system. This one uses phosphoric acid, which will convert all of the types of inorganic carbon compounds (known as inorganic carbon species) into CO2 gas. Nitrogen is used as a carrier to move the evolved gas through drying traps and into the detector. Here, reagents are added that make solutions whose electrical conductivity vary depending on their concentration. A determination of the total inorganic carbon can be made from the highly sensitive measurement of the electrical current that will flow between two electrodes (one silver, the other platinum) in the measuring device. This instrument is called a coulometer, named for the minute units of electrical charge it measures (coulombs.)
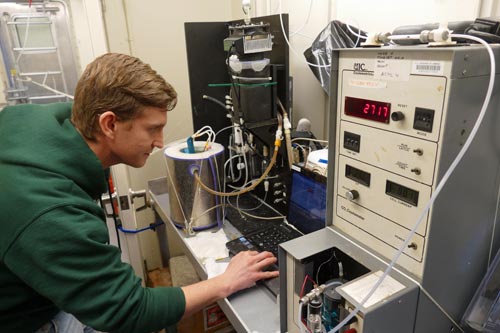 Ryan Woosley determining total inorganic carbon for a sample using an automated coulometer system.
Finally, the team calculates the partial pressure of carbon dioxide in each sample (which tells them how much dissolved CO2 is in the sample.) The calculation is complicated, with temperature, salinity, pH, alkalinity, and total inorganic carbon values used to determine the value. The ships underway water sampling system measures this value for surface water, allowing for a comparison value. But for deeper samples, the calculation is made from the other parameters that have been determined separately.
Thanks for the tour and expert explanations, Ryan!
GO DEEPER!
Why is ocean acidification a growing concern among climate scientists and ecologists?
Aloft Con web cam updated every hour
Healy Track
That's all for now. Best- Bill

