Cruise Day 54
Speed 7 knots (kts)
Course 227° (SW)
Location Canada Basin, ~220 nm north of Barrow, Alaska
Depth 3900 m
GO DEEPER DISCUSSION: (see previous journal for the questions.)
Radon exposure can increase one’s chances of developing lung cancer, so the Environmental Protection Agency has established guidelines for determining if indoor concentrations of the radioactive gas are acceptable or if they exceed safe levels. If radon concentrations are higher than acceptable, simple strategies to abate the hazard such as increasing ventilating in the structure or pumping air from beneath the foundation can bring the levels back to safe levels.
TODAY’S JOURNAL:
We’re back on science hiatus today due to gale-force winds and resulting high seas. For most of the day winds have been at 35-45 knots (40-52 mph.) Our cruise completion date of 12 October is sneaking up on us, and the chief scientists are starting to have to prioritize our remaining time at sea. So after waiting for a while without seeing any improvement in the weather, the decision was made to head off towards our next station without fully completing our super station. The swell is estimated at 10-15 feet and growing as the winds continue, and it is exhilarating to watch waves spray up over Healy’s bow as we drive on into the gale. I’m happy to say that the ship rides pretty well in the heavy waves. I’ve spoken with crew members and scientists who have been on other ships that roll quite a lot in heavy seas, but Healy’s size and squared-off hull limit our rolling motion quite a bit. We’ll have to see if things calm down enough to start sampling at our next station or if more waiting is in store. On an expedition like this there are no other days off built into the schedule – science must go on at any time of the day, any day that it can. So at least the lull in sampling gives the team time to rest, catch up on organizing data, and work on papers and correspondence. The other good news about moving on to the next station is that our internet satellite connection seems to be improving. We are also getting better Armed Service Channel TV now, and perhaps tonight’s Thursday Night Football game will be watchable without constant screen freezes and black outs like last weekend’s game offerings.
 A wave smashing over our bow this morning is good indication of the strength of the wind and high seas today!
Before sampling was suspended, we did fit in a couple more ODF rosette casts off the starboard A-frame yesterday. With the GEOTRACES rosette still in limbo until things calm down enough to evaluate the damage to its cable, I was able to spend a little more time with that side of the sampling operations. I had been meaning to learn about the sampling that Melissa Miller, Nutrient Chemist at the Scripps Institute of Oceanography, performs on every water sampling cast. She was happy to show me the nutrient sampling ropes in the Healy’s wet lab.
When the team speaks of nutrients they are talking about chemicals that phytoplankton can use for growth, somewhat like fertilizer for your lawn or vegetable garden. Specifically, Melissa is quantifying four main nutrients: phosphate, nitrate, nitrite, and silicate. Only a small volume of water is needed for this profiling, but the tests are performed for every bottle on the rosette (as opposed to many other tests that are only performed for each depth sampled.) This leads to a lot of samples to be tested, as the ODF rosette has 36 bottles and undergoes multiple casts on each station (and even more on a super station.) To help, the nutrients analysis system is fairly automated. Still, there’s plenty to do each times nutrients are measured.
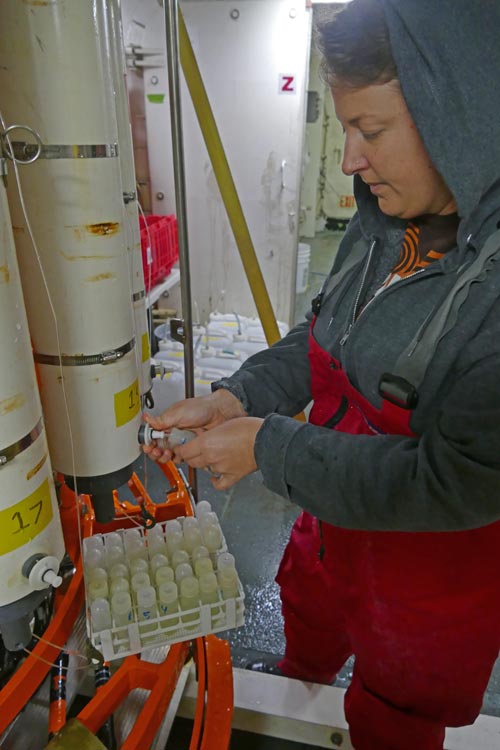
Samples are first collected from every bottle on the rosette, with the first step being to rinse the small sample bottles a few times and then fill them. Scrupulous care is given to keeping track of the sample bottles by numbering each and recording which sample bottle came from which Niskin bottle on the rosette as they are sampled.
 Melissa Miller gathering nutrient samples from the ODF rosette in Healy’s starboard staging bay.
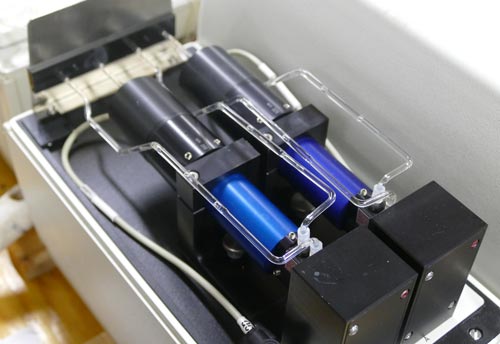
Then, in the wet lab the small sample bottles are arrayed in a tray below a robotic sampler. For each bottle’s turn the sampler first rinses the intake line in distilled water, and then moves into position to begin pumping the water to be sampled up into the system. A valve distributes the sample water into four separate streams, each receiving precise small amounts of testing reagents before entering flow-through photometer cells that measure the values of each nutrient by precise recording of color changes in the solution. The system is mesmerizing to watch as each line has bubbles interspersed at uniform intervals every few centimeters moving steadily along during the process. The bubbles break the solutions into separate packets for measurement, help mix the solutions by introducing turbulent flow, and allow visual monitoring of the chemical movement along the system.
 Melissa starts a batch of water samples through the flow-through nutrient sampling system.
 The water samples are each measured in turn, starting with this robotic sampler.
 Two of the photometric cells that measure color values to determine nutrient levels.
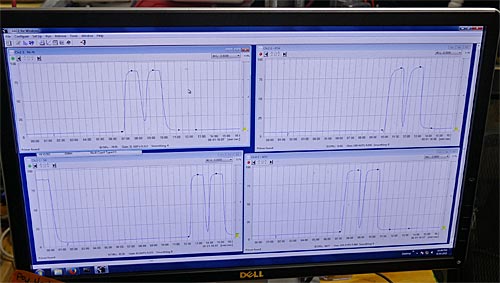
 Final values for phosphate, nitrate, nitrite, and silicate levels in each sample are recorded by computer.
Besides their significance to marine life, measuring nutrients while at sea has another very important role. When multiple sampling bottles on a rosette are supposed to close at the same depth, a way to confirm this is to check the nutrient values from each bottle. If they match up well, scientists can have confidence that the bottles closed properly. But if the values are off from each other, it can indicate a problem while there is still time to address it during the cruise. For example, perhaps a bottle needs repair or the triggering mechanism on the rosette needs fine-tuning. The data from any suspect bottles can be flagged or even thrown out if the nutrient values are way off in bottles that were supposed to be sampling the same depth. Scientists have the nutrient data within hours of a cast, so they can also decide to re-sample an area if the data is critical to the expedition.
GO DEEPER!
Most of you faithful journal readers have done a chemical test involving a color analysis. Fancy photometric cells aren’t always needed- just looking at a test’s resulting color or perhaps comparing it to a color chart can work pretty well. Can you think of an example of a simple color-based chemical analysis test?
Aloft Con web cam updated every hour
Healy Track
That's all for now. Best- Bill

