Cruise Day 55
Speed 2 knots (kts)
Course 124° (SW)
Location Southern Canada Basin, ~122 nm north of Barrow, Alaska
Depth 3580 m
GO DEEPER DISCUSSION: (see previous journal for the questions.)
Many simple chemical tests involve color changes. Most students will have used pH indicators (like red cabbage juice or bromothymol blue, and pH paper) before they reach high school. Chemistry students in high school and college have likely done at least one titration to determine the concentration of a solution. People with aquariums often do simple water quality tests that rely on color changes to indicate levels of chemicals being tested such as ammonia or nitrate.
TODAY’S JOURNAL:
Unable to do science in yesterday’s high winds and large waves, we instead drove southwest to give the storm time to blow itself out. As the morning brightened today it looked like the strategy worked- the ocean looked a lot friendlier (though still plenty wavy) and the wind was about half the speed of the day before. After being in ice-clear water we had some big thumps overnight as we hit the occasional piece of drifted ice and today we’ve been seeing bits of broken-up floes widely scattered. We are almost to the southern end of the Canada Basin, and after this sampling station the depth should decrease dramatically. Equipment difficulties also seem to be solved for now, so a full suite of sampling operations is underway and scheduled to run through the night into tomorrow morning. A sign of the nearing north shore of Alaska is increased bird activity, with two species of Arctic gulls (Ross’s and Glaucous) seen from the bridge this morning. Ross’s Gulls are small but beautiful, with a pinkish cast to their bellies while Glaucous Gulls are robust and appear to be nearly all-white.
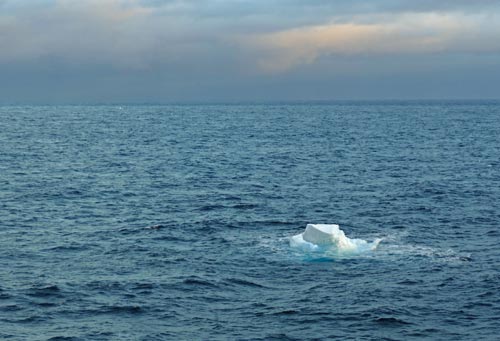
 A leftover piece of ice thick enough to survive transport this far south adds a nice counterpart to the wide unbroken sea of the southern Canada Basin.
As samples come in from the ODF sampling rosette, another critical test for the water at each depth is to quantify its dissolved oxygen. Dissolved oxygen is an important indicator of biological activity in water masses, produced by photosynthesis and absorbed at the air-ocean interface on the one hand and consumed by consumers (animals and decomposers) on the other. Interpreting levels of dissolved oxygen through a water column also can help to identify different water masses and how they move through ocean basins.
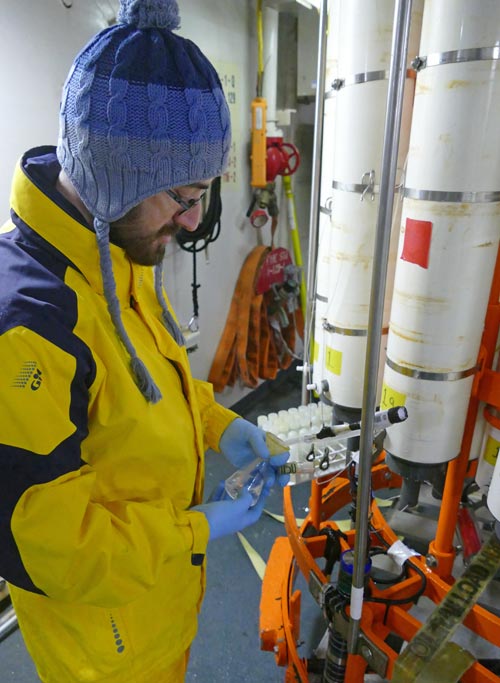
There are electronic dissolved oxygen sensors on the sampling rosette that return immediate data during a cast, but the lab analysis of water at each sampled depth provides more accurate values and helps oceanographers to calibrate their dissolved oxygen sensors and have a higher confidence in their data. Andrew Barna, Chemist for Scripps Institute of Oceanography, is charged with making these measurements on our 2015 US Arctic GEOTRACES expedition.
 Andrew Barna collecting water samples for dissolved oxygen analysis.
Andrew starts by collecting a flask full of water from every depth sampled (but not every bottle.) The flask is intentionally filled to overflowing and then stoppered with a glass plug to avoid any bubbles or air spaces in the sample that could change the dissolved oxygen levels. To determine the dissolved oxygen concentration a technique called a Winkler Test is performed. Chemicals are added to create a manganese hydroxide precipitate which the dissolved oxygen reacts with.
 Andrew Barna adds chemicals for the first part of the Winkler Dissolved Oxygen test.
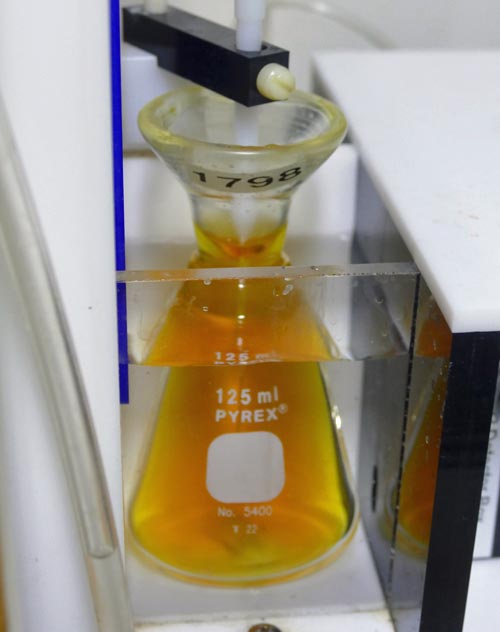
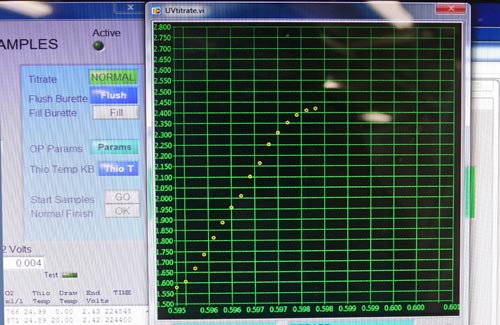
Then, in the nearby wet lab, this oxidized precipitate is dissolved again with hydrochloric acid. The solution also takes on a brownish-orange color due to iodine reacting with the oxygen. This is titrated with a thiosulfate solution until it turns clear to calculate the concentration of dissolved oxygen in the water being tested. The titration is done automatically on a machine that pumps the thiosulfate solution into the sample flask while it is mixed with a magnetic stirring system. It also has an optical cell to detect precisely when the color change ends, and from this a computer calculates and records the final dissolved oxygen value.
 Automated Winkler dissolved oxygen test system.
 At the beginning of the iodine titration, the solution looks brownish-orange.
 When complete, the titrated solution is clear. The automated system determines the end point of the titration using a photo cell in the black housing at the right of the image. The light source is on the left, and the flask is immersed in water to allow the most efficient light passage through the system. At this point the dissolved oxygen value can be calculated.
 The photo cell determines how much light passes through the flask (y-axis values.) The value climbs as the solution gets clearer, and when the data levels off (as you can see in the top left of the graph), a dissolved oxygen level is calculated (x-axis values.)
GO DEEPER!
Our Canadian counterparts almost had a major problem with the trace-metal clean Vectran cable used for their GEOTRACES rosette- check it out: http://www.dispatchtribunal.com/researchers-panic-as-polar-bears-try-to-eat-200000-equipment/6030/
Aloft Con web cam updated every hour
Healy Track
That's all for now. Best- Bill

