Roots
Over the last two days we re-visited the low and high density forests to take some soil samples to process back in the lab. The focus of the samples was on the roots within the soil and where they are concentrated in relation to depth.
The process
In order to do this we cut a 12 x 12 cm square in the top layer with a small hand saw. Every 5 cm in depth we take out a section, wrap it in tin foil, label it, and bring it back to the lab for analysis. In the hole that remains we place a temperature and soil moisture probe directly in the soil every 5 cm and record. This process is repeated until we reach the permafrost layer, which is found as shallow as 13 cm in high density forest where the ground receives more shade from the sun.
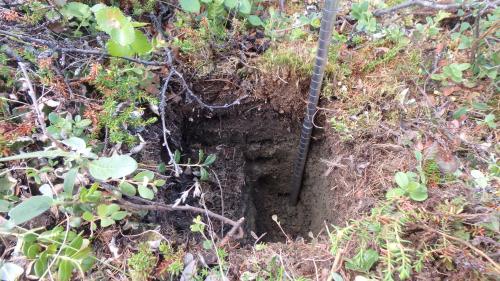 Soil sample excavation with thaw depth probe to measure depth
Thaw depth
Alongside each soil sample, we also take a thaw depth measurement, which measures the thin layer of soil that sits on top of the permafrost layer. Remember, permafrost is the frozen layer of ground that remains frozen year round and has remained below 32 F or 0 C for at least two consecutive years. The measurement is taken with a thaw depth probe, which is a simple aluminum rod with 1 cm increments on it and a sharp end. The probe is pushed into the ground until it hits the permafrost layer.
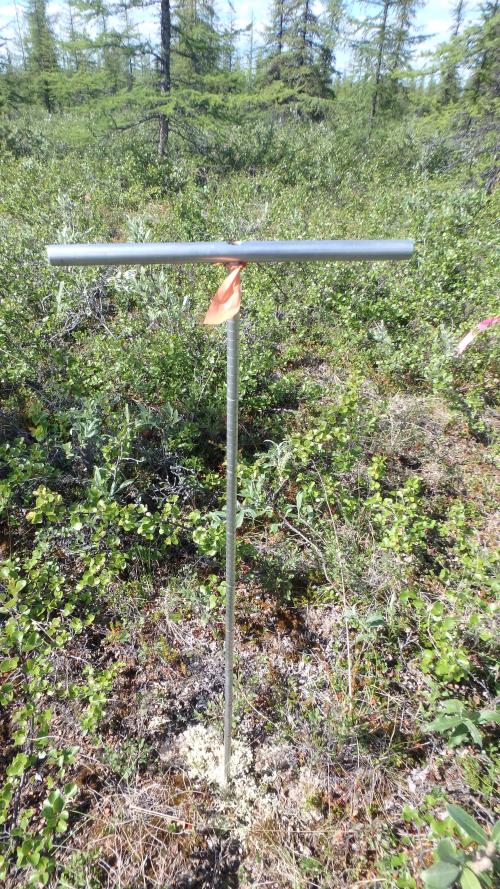 Thaw depth probe used to measure the current depth of the ative layer before hitting permafrost
Soil profile
The soil here in the Arctic consists of the active layer on top of the permafrost. The active layer is the portion that thaws and refreezes every year and contains organic material. It starts on the surface with a layer of living vegetation like moss, grass, or lichen. It is very thin and often has a spongey feel to it. Beneath that is a layer of organic soil where most of the live roots are. This layer is brown in color, cool to the touch, but is not full of bugs, worms and rocks like we might see in the topsoil back in Buffalo, NY. Just below that, a mineral layer exists that is gray in color, more dense than the layer above, and has a clay-like consistency. Below that it is permafrost. It's not a big block of ice, but more like frozen solid soil.
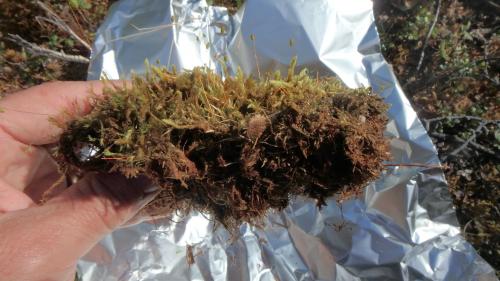 Section of the vegetation portion of the soil profile.
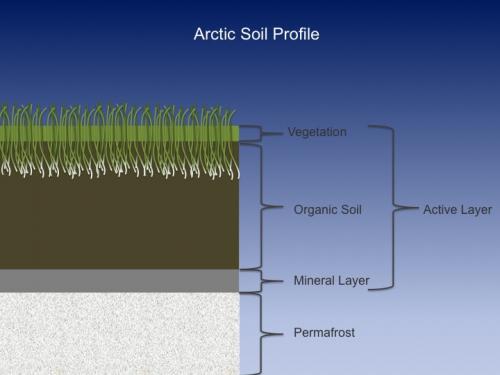 Soil profile diagram for Arctic conditions
Water Potential
Another new device we used today is a pressure chamber. It is used to measure water potential in plants or a plant’s ability to transport water. In a given plant, water will move from high water potential, in the soil, to low water potential, in the air around the leaves. This gradient allows a constant flow of water through the plant. At certain times of the day a plant may use more or less water based on the conditions. For example, if the plant is stressed out due to colder temperatures or the lack of moisture in the soil, it may be more constricted and take more pressure to pull the water out. If the plant is less stressed out, water may flow through it more easily without much of a pressure difference.
One way to observe a plant’s water potential is is by using this pressure chamber. The first step is to clip a leaf and its stem off of a tree and place it inside the airtight pressure chamber. At the top of the chamber there is a hand lens that allows the researcher to look down into the device at the stem. A reading is obtained by pumping the chamber like a bicycle pump and carefully watching the stem to see at what pressure the water is forced out.
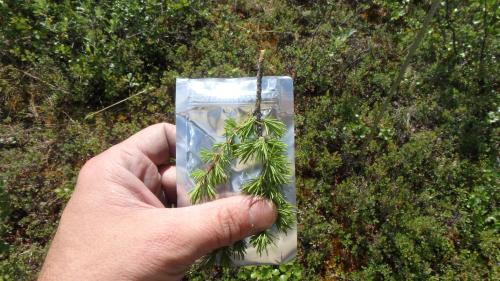 Clipped branch from a larch tree ready to be sampled for water potential
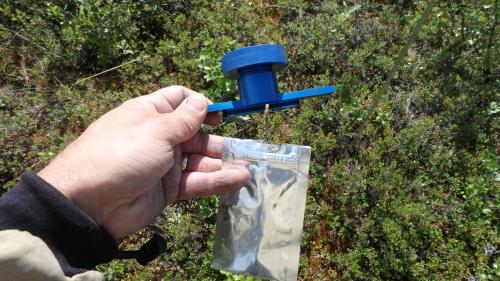 Tightening the larch branch to the pressure chamber lid
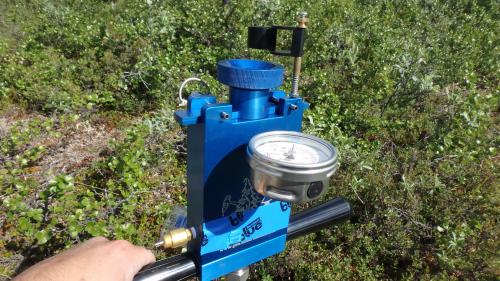 Pressure chamber to measure water potential
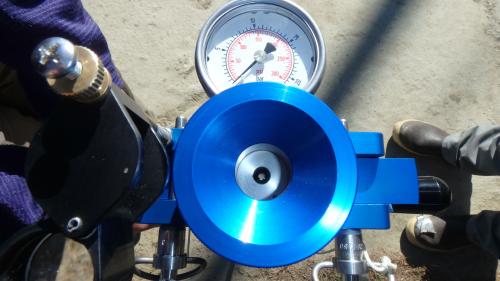 Branch is in the pressure chamber ready to measure water potential
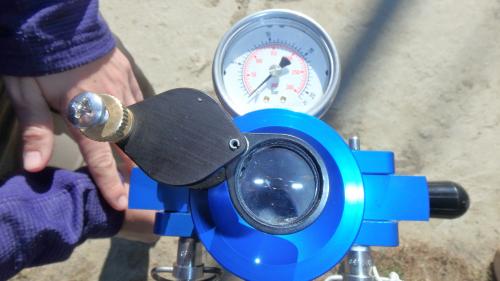 The hand lens is in place for better viewing of the stem
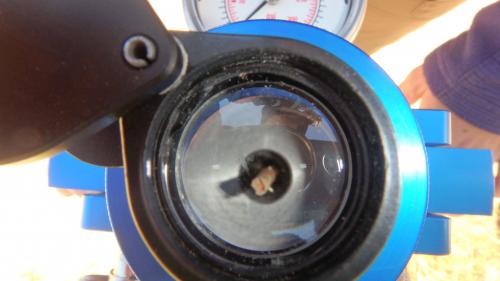 Looking down the hand lens at the cross section of the branch to see if it has pushed out any water
So why are we doing all of this?
The soil samples are taken at depths to see where the greatest amount of roots are present and will continue to be taken throughout the season to see if the root concentration changes as the ground thaws during the summer. Temperature and thaw depth will also be measured throughout the summer months and can be combined with ambient temperature and forest density. All of this data, along with the instrumentation that we mounted this past week, will be compiled at the end of the season and compared with previous seasons for analysis.

