Overview
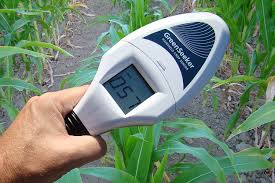
Melissa Lau spent a month in the tundra ecosystem gathering data using a device called a Greenseeker. This device measures exactly how green a plant is by calculating its NDVI or Normalized Difference Vegetation Index. In this lesson, students will explore light waves, how they interact with plants, and find out how green is green.
Objectives
- Students will be able to develop a model to show how light waves interact with a plant.
- Extension: Students will be able to use the NDVI values to quantify how much light is being reflected from the plant.
Lesson Preparation
- Students will need an understanding that visible light can be separated out into a spectrum of colors and that each color represents a different light wave frequency and that there are light frequencies like ultraviolet and infrared that we cannot see.
- Students will need to know the difference between quantitative and qualitative measurements.
Procedure
Begin with a driving question: How can you measure green? It’s such an odd thing to ask. How do you measure a color? Give students a few moments to think about this task. They will offer some interesting ideas.
Start guiding students’ thinking about measuring a color by guiding them with these discussion questions:
1. What is color? How are colors related to light?
2. Why do most plants appear green to our eyes?
3. Are there devices that exist that can sense (or measure) light?
4. What types of devices do this?
5. Why might a scientist want to measure how green a plant is?
6. Why would having a quantitative measurement of greenness be better than a qualitative measurement?
Show students a picture of a Greenseeker.
 Greenseeker handheld device
Plants will absorb more red and blue light and reflect green (that we can see) and near-infrared (that we can’t see). Our human eyes cannot see near-infrared (NIR) because it lies outside the visible spectrum. These devices capture near-infrared light that plants reflect and measures the intensity of that NIR. Teacher note: There is a great article overview of NDVI from GIS Geography.
Return to the question: How can you measure green? Students work in groups to develop a model of a healthy green tree and light waves interacting. Have them create a way to represent the NIR light being reflected that shows it is not visible to human eyes but is visible to instruments like Greenseekers or satellites. Challenge them to think about what the same tree and light waves model might look like in the fall when the leaves are no longer green.
Extension
See the resources for links to My NASA Data lesson. Students can use satellite data to make connections between the amount of rainfall and the greenness of the planet.
Transferability
This is a 1-2 day lesson that can easily be done in a classroom setting without any extra materials needed.
Resources
GIS Geology article My NASA Data
Assessment
Use the model that students create of light waves interacting with a green, healthy tree. They should show reds and blues being absorbed and green being reflected. They should show that NIR is also reflected.
Author/Credits
Melissa Lau, PolarTREC Educator 2018 Piedmont Intermediate School Piedmont, OK melissa.lau [at] piedmontschools.org
Standards Other
MS-PS4-2 Develop and use a model to describe that waves are reflected, absorbed, or transmitted through various materials.
| Attachment | Size |
|---|---|
| Download Lesson Plan 601.88 KB | 601.88 KB |
