NASA’s Operation IceBridge uses remote sensing techniques to build a picture of parts of our world not accessible or easily observed by humans. Flying 1500 feet above sea and land ice, the science team uses LiDAR, Radar, Infrared imaging, and high resolution digital imagery to collect information about our polar regions year after year. In this classroom project, inspired and adapted from Mark Buesing and Tim Spuck’s remote sensing lessons from 2012-2013, students will use data from Vernier motion sensors to develop a vertical profile of a hidden region of terrain simulated using classroom materials and sonar.
Objectives
Students will be able to use data from Vernier motion detectors to construct a vertical profile of a covered topographic surface by plotting position vs. time data.
Students will demonstrate an understanding of remote sensing techniques that can be applied to use in polar studies, seafloor mapping, and vegetation cover studies among others.
Lesson Preparation
The lesson is organized in three sections or modules.
Module 1: “Graph Matching with Vernier Motion Detectors” is an introduction to using the Vernier Motion Sensors to log position-time data. This is described in more detail in the procedure below and in the attached student handout. Prior knowledge includes an understanding of the Distance=Rate * Time relationship. After students follow the procedure to match a computer generated position-time graph by walking toward or away from the ultrasonic signals produced by the motion detector, they complete a set of discussion questions to analyze how the sensors work. This is all included in the first part of the student handout.
Module 2: “Context, Demonstration, Introduction to Remote Sensing in Earth Science,” allows students to dive into the science behind remote sensing. This section begins with a preview of Module 3’s Official Challenge followed by an exploration activity in which students to do web research on the use of remote sensing techniques by NASA’s Operation IceBridge campaign, an airborne survey of Earth’s Polar Regions. Students are guided through an example explaining the idea behind the use of remote sensing to measure surface elevation. (NOTE: This is BASIC example explains the use of the distance-rate-time formula but DOES NOT take into account the complexities of light wave propagation or compare the use of LiDAR to Sonar). Students complete a practice problem applying the distance-rate-time formula to a sonar device. Again the complexities of wave propagation and interference are not included in this lesson, but may be explored as an extension for older students.
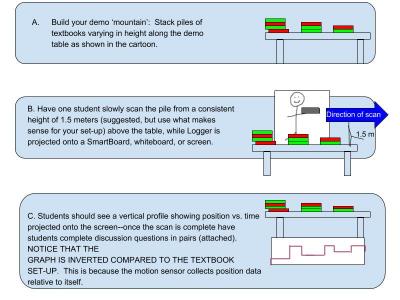
Module 2 also includes a remote sensing demonstration using textbooks, the motion detector and a student volunteer. Set up several piles of textbooks, varying in height side-by-side on the floor or on a demo table. A student will slowly pass the motion detector over the ‘textbook mountain range’ from a constant height. The instructions use 1.5 meters; depending on the height of the table and student volunteer or availability of a step stool that may be too high. Adjust accordingly as long as it is consistent! Finally students are guided through transforming the data into a vertical profile that accurately depicts Textbook Mountain. The sensor collects position data relative to its own position. For every data point provided, to find the actual surface elevation of the textbooks, you must subtract the given value (distance of surface FROM sensor) from the height of the sensor (1.5 m or the adjusted value that fit your classroom). This is explained in the procedure and student handout.
Module 3: “The Challenge, Design, and Proposal,” revisits the official challenge preview, encourages students to creatively think about the engineering design process in addition to their new remote sensing knowledge. The final assessment for this unit is embedded in the student reflection following the activity set. Students are challenged to prepare a remote sensing tool that uses Vernier motion detectors to measure a hidden region of the Earth from at least 2 feet away. As instructed in the procedure below, teacher prep will involve setting up an assortment of objects varying in height in an opaque box with an open top. Students are charged with designing an apparatus to scan the region from the 2 ft point and then transforming the data into a true representation of the simulated mountain. Students can create a manual handle using PVC pipe or other miscellaneous materials. If Lego Mindstorms or other robotics are used in your classroom, students can program a robot to do the scanning. Any variations or ideas are welcome here. Students will have two chances to test their models with one revision in between. They should successfully replicate the hidden landform without being able to see it.
Procedure
Module 1: Graph Matching With Vernier Motion Detectors (1-2 CLASS DAYS)
- In pairs or groups of 3, students should complete the Vernier “Graph Matching” lab adapted from https://www.vernier.com/experiments/pwv/1/graph_matching/. Student handouts for this activity are included in the attachments.

Graph Matching Overview:
a. Students are provided a position vs. time graph on the Logger Data Window as shown above.
b. Students follow the “Student Instructions” found at the attached pdf file to create and carry out a plan to walk toward, walk away, or stand still for a specific time intervals until they have a graph that matches the computer-generated one.
Skills:
position vs. time, graph interpretation
Assessment:
Discussion questions in Handout at the end of Module 1.
Context and Demonstration (2-4 Class Days)
1. Set up the task:
Allow students to read the Challenge Preview in the Module 2 packet of handouts. Explain to students that they will be charged with using sonar to construct a vertical profile of a hidden surface region on Earth using remote sensing methods. Explain they will need to go through the basics of remote sensing in Earth Science (follow the student-guided handout or provide direct instruction using the information in Step 2 below).
2. Introduction/Lecture:
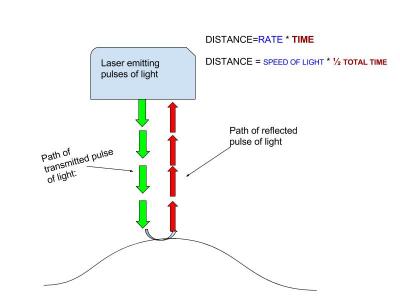
Students should know that remote sensing is a technique used to gather information from a distance and is often used in Earth Science to gather large data sets by taking advantage of energy waves and rates relationships. For example, by transmitting a wave through air or water, knowing the speed of that energy (sound, light, radio) in said medium, and the amount of time it takes for the wave to be reflected back to the sensor, a position value can be found. Guide students through the example below. While this example uses LiDAR and the speed of light as its source, please note that this DOES NOT take into consideration the complexities of light wave propagation, but describes the application of the distance-rate-time formula in remote sensing techniques. Students should be able to apply that relationship to sonar in practice problem A.
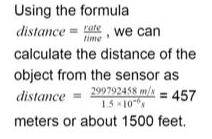
Example: A pulse of light travels from a remote sensing source as depicted in the cartoon below. The pulse is reflected back in a total time of 0.000003 s. This means it took half of that time .0000015 s to reach the object in the first place. The speed of light in air is c=299,792,458 m/s.
Debrief:
The remote sensing devices used on NASA’s Operation IceBridge calculate points in a similar way throughout 8-12 hour missions over pre-planned flight lines. View the video on data visualization of Greenland’s Helheim Glacier linked below to get a better picture about how height is used to measure ice topography.
Laser Visualization of Helheim Glacier:
3. Demonstration Activity:
Begin by discussing the fact that when completing the ‘Graph Matching” portion of this project, the target (student) was moving. When using devices to map stationary regions on Earth, the DEVICE needs to move rather than the target. Now follow the set-up instructions below while students complete associated questions in their Module 2 handouts.
Discussion:
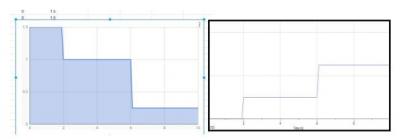
Notice the map projected on the screen is not the same shape as the textbook set-up on the table. This is because the position data collected is providing position values as measured from the source (motion detector) to the nearest object from it (stacked textbooks or table where there is no pile).
Assessment:
Students complete attached discussion Questions (found in Module 2 Student Handout under demonstration).
4. Create Vertical Profile:
Guide students through one or both of the following processes to transform the data collected by Logger Pro or Lite into a true vertical profile of the terrain passed over by the sensor. The first method requires internet access and Google Sheets. The second can be completed without computer aid with paper and a pencil.
A. GoogleSheets Method
Below is a sample data set. Yours may look similar or very different and it may have more or less data points. You might see noise thanks to interference from other objects beneath the scanner. (TIP: If you are not seeing the table to the left of your graph, select ‘Insert’ and then ‘Table’ from the menu at the top of your Logger window).
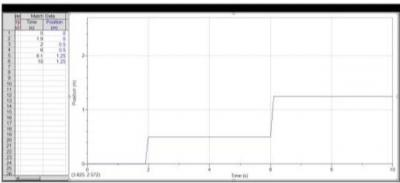
- Use your arrow to select both the Time and Position columns for the data representing your demo mountain range. Use the Ctrl+C combination to copy the data from those columns. Paste that data in a new Google Sheet as shown below (Column A is time and Column B is position):
Note: You may choose to either have students enter the data themselves, or complete this step ahead of time and share the file with all students. Make sure students choose the option to ‘Make a copy’ before they begin to do their own editing.
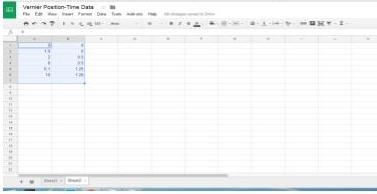
- Next, in order to find the true height of each mountain, the position data recorded should be subtracted from the height above tabletop (or height above ground level) of the sensor.

To quickly calculate the actual surface height in Sheets follow these steps: 1. Select Cell ‘C1.’ 2. Assuming Column B holds your position data, in cell ‘C1,’ enter the formula =1.5-B1 3. Click the bottom left corner of Cell C1 and drag it down through column C until all position data has been transformed. You may choose to have students complete this part manually.
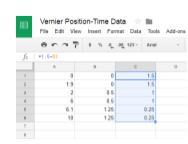
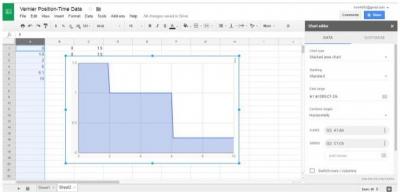
Click ‘Insert’, then ‘Chart,’ and choose an area chart from the menu in Sheets. In the x-axis option select the entire range of data from Column A (time). In the ‘Series’ option, select the entire range of data from Column C (new surface height).
You should see a graph appear that reveals the true shape of the scanned terrain:
Compare the graphs side-by-side and confirm that the new graph does match the original surface topography of the textbook mountain range. Notice the relationship between the sensor-recorded graph and the one revealing true surface data.
B. Alternative Manual Method
Provide students with a copy of the numerical data OR the graph. Have students manually determine the actual surface height values and plot their new position-time graph on graph paper. If the data represents a graph that is exceptionally noisy, students can approximate constant values for a particular time intervals. Students will manually subtract those values from the height of the scanner (1.5 m or otherwise) and re-plotting them against the time intervals chosen.
Assessment:
Student Near-Transfer Task, provided in student handout labeled 7. Checking Mastery.
The Challenge (1 Week+)
Students will be provided with the full challenge sheet described in the Module 3 packet. To prepare for this module, follow the instructions below.
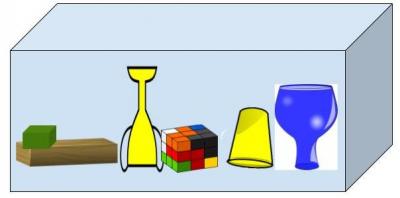
- Instructors should fill an opaque box (ideally a minimum of 2’ x 3.5’ to minimize interference with sound waves by the edges) with an assortment of objects ranging in height (textbooks, upside down cups, vases, blocks, modeling clay--whatever you have on hand to create a variety of surface heights).
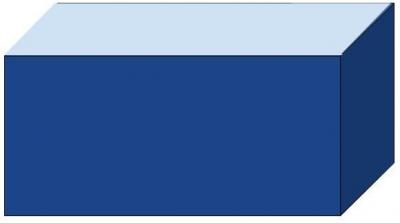
Student View:
Provide students with Module 3 handouts including the rubric. Students will be challenged to use their PVC pipe, duct tape, meter stick, and any other additional tools in the classroom (Physics carts, Lego Mindstorms Robots, themselves, springs, etc.) to design a tool and procedure to map the surface region hidden by the box.
Students should follow the procedure laid out in the Module 3 handout. They will require approval of their design before building. When their vertical profiles are complete, reveal the set-up inside their boxes and compare the height values to the real materials. If there are many inaccuracies allow them a second iteration to get it right using the Vernier logging software and Excel.
Students will complete a reflection sheet and proposal to recommend their design and procedure to NASA for use in collecting information about hidden regions of Earth.
Extension
Have students prepare a presentation to explain the concept behind their group design to an audience of geoscientists, political officials, fellow students, or stakeholders.
Alternatively, for advanced students explore forms of remote sensing other than sonar. Examine major differences between the use of LiDAR, Sonar and Radar in mapping Earth’s feature.
Resources
https://www.vernier.com/experiments/pwv/1/graph_matching/
Assessment
A rubric is attached to assess student’s mastery of the concept and application of remote sensing using the final reflection handout.
Author/Credits
Author: Kelly McCarthy kxm5002 [at] gmail.com
Concept Inspired by and Adapted from Tim Spuck and Mark Buesing
Strategies for STEM Integration and Assessment developed as a result of work with Notre Dame Center for STEM Integration as a STEM Trustey Teacher Fellow
Standards Other
Common Core State Standards
Mathematics
MP.1 Make sense of problems and persevere while solving them.
MP.2 Reason abstractly and quantitatively.
MP.4 Model with mathematics.
MP.5 Use appropriate tools strategically.
HSN.Q.1 Use units as a way to understand problems and to guide the solution of multi-step problems; choose and interpret units consistently in formulas; choose and interpret the scale and the origin in graphs and data displays.
8.SP.A.1 Construct and interpret scatterplots for bivariate measurement data to investigate patterns of association between two quantities. Describe patterns such as clustering, outliers, positive or negative association, linear association, and nonlinear association.
ELA/Literacy
WHST.6-8.1 Write arguments focused on discipline-specific content.
WHST.6-8.1.a Introduce claim(s) about a topic or issue, acknowledge and distinguish the claim(s) from alternate or opposing claims, and organize the reasons and evidence logically.
WHST.6-8.1.b Support claim(s) with logical reasoning and relevant, accurate data and evidence that demonstrate an understanding of the topic or text, using credible sources.
WHST.6-8.1.c Use words, phrases, and clauses to create cohesion and clarify the relationships among claim(s), counterclaims, reasons, and evidence.
W.9-10.2 Write informative/explanatory texts to examine and convey complex ideas, concepts, and information clearly and accurately through the effective selection, organization, and analysis of content.
WHST.9-10.2 Write informative/explanatory texts, including the narration of historical events, scientific procedures/ experiments, or technical processes.
RST.11-12.2 Integrate and evaluate multiple sources of information presented in diverse formats and media (e.g., quantitative data, video, multimedia).
Next Generation Science Standards
Students who demonstrate understanding can:
MS-ETS1-1. Define the criteria and constraints of a design problem with sufficient precision to ensure a successful solution, taking into account relevant scientific principles and potential impacts on people and the natural environment that may limit possible solutions.
MS-ETS1-2. Evaluate competing design solutions using a systematic process to determine how well they meet the criteria and constraints of the problem.
MS-ETS1-3. Analyze data from tests to determine similarities and differences among several design solutions to identify the best characteristics of each that can be combined into a new solution to better meet the criteria for success.
MS-ETS1-4. Develop a model to generate data for iterative testing and modification of a proposed object, tool, or process such that an optimal design can be achieved.
PA State Standards (High School Physics)
Pa. The student will demonstrate an understanding of how scientific inquiry and technological design, including mathematical analysis, can be used appropriately to pose questions, seek answers, and develop solutions.
PAa.2 Use appropriate laboratory apparatuses, technology, and techniques safely and accurately when conducting a scientific investigation.
| Attachment | Size |
|---|---|
| Full Lesson: Remote Sensing in Polar Regions and Beyond (PDF - 1.25 MB)1.25 MB | 1.25 MB |
| Lesson Materials and Rubric873.93 KB | 873.93 KB |
