Easter Sunday
As mentioned previously we do not fly on Sundays. And Easter Sunday is more special than most here. Since Greenland is about 88% Lutheran Easter, the locals takes this day to heart. A case in point is that the one grocery store in town was open for only a few hours on Friday, not at all on Saturday, Sunday or Monday. One must plan meals carefully around Easter, evidently.
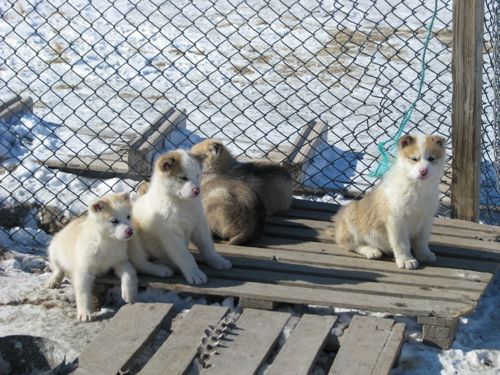
 Obligatory "Awwwwww...." moment. Before stuffing myself on an Easter dinner I walked out to the edge of town to visit the sled dogs.
 Today's cute calendar spread is tomorrow's sled dog.
The Easter tradition for the OIB crew is for everyone to bring a dish to share (potluck style) and if you can't do that then you had better be ready to wash dishes. I was part of a two person team who made three passable apple crisps. They would have been better if we had a better choice of apples and if they had been large enough to warrant peeling. So I chopped up about 20 or 30 small apples, skin on, and let the chips fall where they may. I also bought three containers of vanilla ice cream - a very expensive treat here - to go with the crisp. On top of that other folks donated a cake, a cheesecake, cookies, and brownies.
The main entree submissions included a slow-roasted leg of musk ox (good!), two hams, jumbalaya, seafood chowder. Side dishes ran the gamut: rice dishes, potatoes, salads, roasted veggies, etc. We had a great time feeding our crew plus about 10 additional folks staying here in the KISS building. Even then we had notable leftovers. A few photos of the meal:
 Kyle Krabill carves the roast beast in Whoville. Wrong story..he carves the muskox haunch in Kanger for Easter dinner.
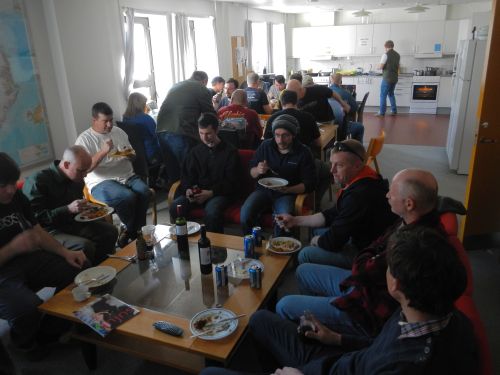
 Our team assembled for an Easter feast. Several people in here are not associated with OIB (the isn't THAT big) but they were invited to join us.
Warning: Tech speak coming up. I thought I'd shed some light on a couple important aspects of OIB, navigation and data storage. So allow me to now delve into a science and math discussion. You were warned...
Navigation
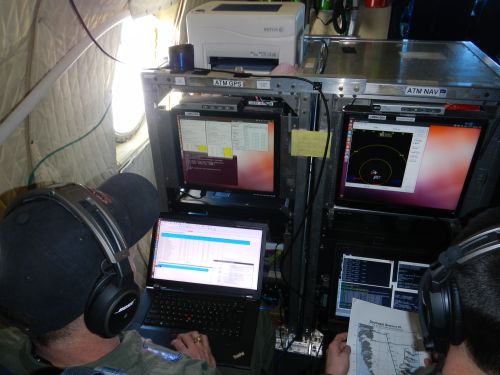
 The navigation station on board the P3. The black portion of the screen on the right is replicated on the pilot's yoke - this is what they follow to keep on course.
When an airplane lines up on a runway it receives a signal from two radio transmitters located equidistant from the center of the end of the runway, one to the left and one to the right. These signals emit slightly different frequencies (audible tones just above and below 100 Hz, carried on radio waves). When the plane receives equal intensities from each transmitter we know that the plane is in the middle of the runway. Navigating the plane so that the received signal intensities remain equal allows a pilot to travel down the middle of the runway even in poor visibility. This concept is, of course, more important when lining up for the runway on a poor visibility approach, but the same technique is used.
For OIB, our P3 must fly identical paths every year so that the data has more relevance. How could you determine whether the ice is changing if you did not sample from the same locations every year? About 85% of the routes we fly are straight lines - or better put, straight lines between between fixed waypoints that whose GPS coordinates are saved in a spreadsheet database. But what is a straight line when were are talking about the surface of a sphere? (Actually the earth is better modeled by an ellipsoid that is wider around the equator than it is around the poles.) Technically if our plane flew the shortest distance between any two locations then it would be a chord that cuts through the theoretical ellipsoid that is the earth. Since any two consecutive waypoints for us are not that far apart we wouldn't have to actually penetrate the surface of the earth to fly this straight line but we would have to continuously change altitude, and this is not desirable. So instead we connect our two waypoints with a small portion of a great circle.
To make this easy for the pilots, our Navigator, John Sonntag, helped write software that ties these waypoints into the plane's autopilot system in a way analogous to the runway approach mentioned above. Using real-time GPS data, the system generates two audio tones that tell the autopilot which way to shift the plane (left or right) in order to stay in the middle of the track between two waypoints. All the pilot has to do is to keep the altitude constant at 1500', or in some cases 500'. The next generation of this navigation software will incorporate altitude data, probably from an enormous database rather than a GPS (not accurate enough). This way the pilots could nap while we fly these routes.
The other 15% of our routes are sinuous trails that trace the fastest moving portions of a glacier - not necessarily down the middle. In this case the pilot must navigate the route manually (i.e. no nap allowed) using GPS waypoints spaced at 150' intervals. Flying at our regular groundspeed of 250 nautical miles per hour (= 300 mph), this means we pass about two and half waypoints every second. On the navigational screen the waypoints have circles centered around them that the pilot flies the plane through. When viewed on the screen it makes sense why they call this the "Pac Man" style of navigation. In this fashion the plane follows paths that overlap every year, even if the ice underneath has shifted and looks different. Which is often the case near the face of a glacier.
The mathematics and technology incorporated into this system is impressive - NASA is currently seeking to patent the navigational system. On the one hand I could not understand why nobody had developed this system sooner, but then I got to thinking about it: How many planes need to fly extremely precise routes, year in and year out? Not many. Those that do will most certainly be doing it for scientific purposes.
Data Storage
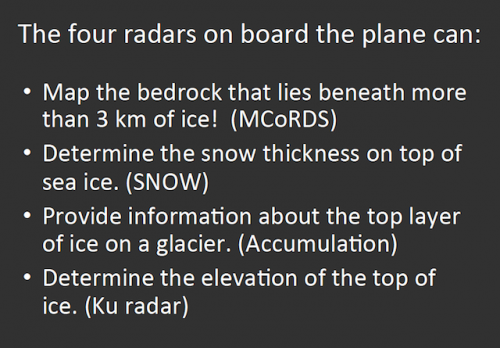
Each 8 hour flight we do generates nearly 3 terabytes of data. About two thirds of that is radar data from the MCoRDS, ACCUM, SNOW, and Ku radars. For anyone who needs a reminder here's a slide from my powerpoint presentation describing what these radars do.
 A list of the radar systems on board the P3 and what they do. There are several other instruments as well.
The raw data from these instruments is nothing but voltage readings. Specifically, the voltage of the reflected radar signals. These signals arrive millions of times each second, on each of 15 different channels to give the beam a wider spread, for the entire duration of our 8 hour flight. As soon as this data comes into the plane it is parsed into files (for easier management) and duplicated onto a server. This instant backup is done for all instruments on board the plane. NASA goes through great pains to ensure no data will ever be lost, be it malfunction, accident, or whatever. [One radar operator told me a story where a similar radar's data on a drone was recovered in full after the drone crashed. Evidently the Department of Defense also goes through great pains to take care of their data.]
Back on the ground, technicians remove the data drives on the plane and store them in a waterproof Pelican case for storage to the KISS building. Here, in the room next to mine, they have set up a portable data processing facility. A mini-supercomputer (16 core processors, 128 GB RAM) makes two copies of the data. This takes about 14 hours - I can hear the computer fans running 24/7 next door as they churn through this data. One set of data heads to Indiana University in Bloomington, IN. The other set heads to Kansas University in Lawrence, KS. Both campus do additional processing of the data to make it more usable for researchers. (Climate researchers would have no idea what to do with an infinite list of voltages.) In Bloomington the data gets churned through a massive supercomputer. (Ready for this? IU's computer has 1020 nodes, each node has 32 core processors, 16 graphics processors, and 64 GB of RAM. That's a beast!)
http://
Many things happen during this post-production of the raw data, but I will mention only one. The raw data is useless (and this is the case with all instruments on the plane) until you factor in the plane's attitude each moment. So every 0.1 second or so the plane's degree of yaw, pitch, roll, and altitude must be measured and recorded. And this is the weakest portion of the data collection. The accuracy of OIB's data could be greatly improved if there existed a more accurate way to measure these values on the plane. (Future engineers: I'm challenging you here and now - this problem can be solved. Get after it!)
The raw data eventually finds its way to a permanent home at the National Snow and Ice Data Center (NSIDC) in Colorado. (Think of the closing scenes of "Raiders of the Lost Ark.") Someday someone may want to use this data in new, groundbreaking ways, that have yet to be discovered, much less considered. And the data will be waiting deep in the vaults of a climate controlled room somewhere in Boulder, Colorado.


Comments