If you torture the data long enough, it will confess. -Ronald Coase
Today we take a look at our data as asked about by three astute high school students who sound as if they are on their way to becoming great scientists themselves.
So here goes...
Our first question comes from Nataria S. from Brooklyn Prospect Charter School. She asks, "How do you organize all your data? How do you analyze it?"
 How do you organize all your data? How do you analyze it?
We have gobs of data and keeping it all in order in a sharable format could be a challenge. The students need to be able to see each other's data and incorporate it into their own individual projects. So for example, Courtney is testing for phytoplankton. She need's Ryan's CTD data to determine how the different water masses are layered in the fjord and determine where the conditions are maximized for the existence of phytoplankton.
So one of the first things we did was to create a shared folder on Google Drive into which all the data can be stored and accessed. I especially find this useful as I plan to bring data back to share with students in a variety of lessons.
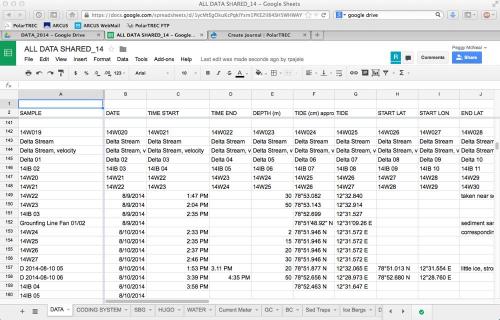 Some of our raw data
Much of the data is initially stored in the instruments, like the CTD, fluorimeter, echo sounder and hobo. When we return to our lab we connect the instruments to our computers and download. Some of the software organizes the data into graphs automatically. But some of the raw data has to be manually plotted to create charts and diagrams that are useful. This can be very time consuming and has kept some students up into the wee hours of the night (well, if you call it night, since it looks like broad daylight out there).
Continued analysis of samples will occur at the students' home universities. We will be shipping out bags of mud, core samples, till samples, bottles of water and filtered water samples when we leave. Hope it makes it through customs!
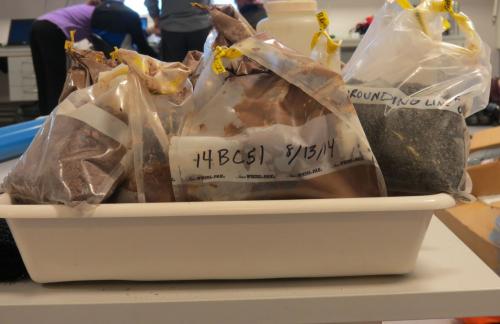 Samplles of mud and till to be packaged and shipped home.
The second question comes from Madison W. at Mill Creek High School. She asks, "After collecting the research, what will be done about any abnormalities that are found in the data?"
 After collecting ther research, what will be done about any abnormalities that are found in the data?
Great question, Madison and for sure that happens. Sometimes we download data, take a look at it and the reaction is, "What the heck?" Often we think about it and chalk it up to an instrument abnormality or misread. Then we go back and repeat the measurement to verify that that is indeed the case. But some abnormalities really cause us to scratch or heads, or as Ross says"rub our grey cells together". (Maybe that is something they say in New Zealand?)
An example is Steve's sediment trap samples. He left them out, collecting suspended sediment for about 24 hours. Once retrieved, they showed clear laminations, or layers at a rate of about one per hour. That would be expected in a sample representing a much greater time duration but in this case it is a surprise. So the question is "What dynamic is causing an hourly change in suspended sediment?" We don't know.
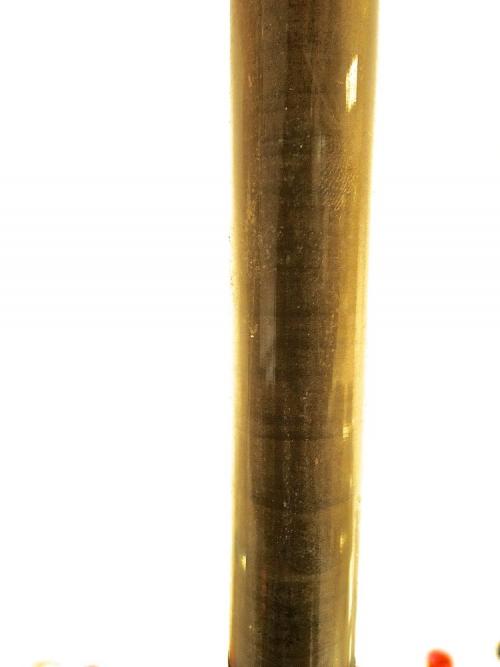 These are the unexpeted laminations in the sediment trap samples.
So today we are using two hobos for the first time and attaching them at two different depths on the sediment trap. A hobo measures pressure in the water column. This will inform us of pressure anomalies between the two depths and the potential existence of two passing water masses. When water masses of different temperatures and densities exist next to each other a wave forms at the interface. This could be a possible explanation for the observed changes in the suspended sediment.
Again Morgan, you asked a great question because having reliable, reproducible data is the cornerstone of scientific research. If we ignored abnormalities, our research would not be validated as reputable science during peer review.
Finally, Katherine R. from Brooklyn Prospect Charter School asks, "How can oceanographic data be used to get a better understanding of what glaciers are doing?"
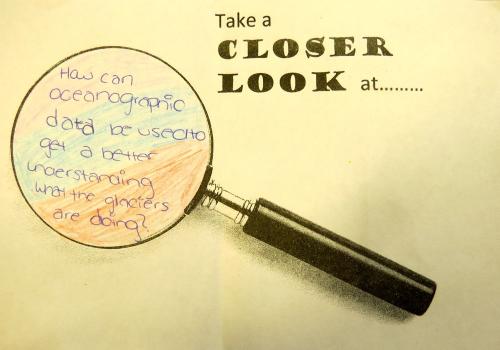 How can oceanographic data be used to get a better understanding of what the glaciers are doing?
Again, it has to do with water masses. We are interested in glacial melt rate and how it influences the water in the fjord. In this part of the world there is also interest in understanding the movement of warm North Atlantic water from the south. As it infiltrates farther north it changes the dynamic of the existing bodies of water. Collecting oceanographic data such as temperature and salinity helps us identify water masses and allows up to see how the water masses are interacting with each other. More warm North Atlantic water will lead to more glacial melting.
Thanks for your questions about data. Let me hear from you! Please send more comments and questions!


Comments