I thought I would use this journal to discuss the type of equipment we will be using and what they will measure, along with some definitions of terms used to describe the field sites. To obtain many of these measurements we need electricity and circuit boards to capture data over an extended period of time. In order to supply power in the field we need an assortment of batteries that vary in size depending on the equipment. We have car size 12V batteries, AA alkaline batteries for short term with mild temperatures, and lithium batteries for longer term with colder temps. Often a solar panel is used as a backup or re-charger to maintain battery levels.
Field sites
For the first few days we have been focusing our work on sites that are within a short drive along the dirt roads of Cherskiy. The field sites are in a boreal forest and were chosen by the amount of shade the ground vegetation gets from the canopy above. An area with a lot of shade from the trees above is considered a high density forest; if there is little to no coverage it is considered a low density forest. We will study the same type of measurements in two sites of varying density to use for comparison.
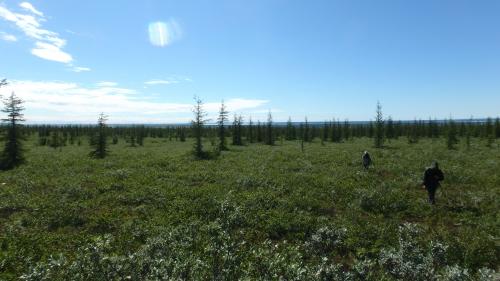 Hiking out of the boreal forest after another productive field day
Terms
Permafrost Permafrost is the frozen ground layer that has remained below 32F or 0C for at least two consecutive years. This frozen ground sits below a thin layer of soil that thaws each summer, called the active layer.
Boreal forest A boreal forest is an area consisting primarily of conifers and is occasionally referenced as the Taiga region of the Arctic. These forest areas are limited to the high arctic and subarctic regions of the planet. In North America, the dominant trees in boreal forests are white and black spruce. The area we are studying in Eurasia contains predominantly a larch species, which is a deciduous conifer.
Canopy The canopy in a forest is measured by the amount of tree branches or leaves that shelter the ground floor from sunlight. A simple density test can be done by looking straight up at the zenith and seeing how much blue sky can be seen through the branches. However, this is measured with a densiometer for the most accurate scientific data. The outcome will determine whether the area has low or high density coverage.
Electronics
Sap flow measurement We are using a Dynamax instrument to measure transpiration, which is water being carried through the plants to their leaves where it evaporates into the atmosphere. Basically, we are looking to see how much water is being used by the plant. To measure this we are using two different methods. In the first, a Thermal Dissipation Probe (TDP) is inserted in the trunk of a tree. A small hole is drilled in the tree for the probe, which has a heating element on it. The sensor will take temperatures before and after the activated heating element as water passes through the tree. The data from the sensor displays a temperature difference that is inversely proportional to how fast the sap is flowing. The greater the difference between the heated and ambient temperature equals a low sap flow, indicating a low transpiration rate. The second style we are using is for shrubs with a branch diameter of at least 1cm.
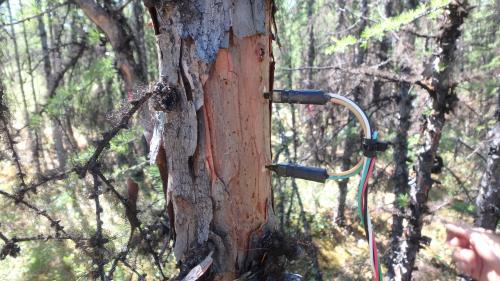 TDP sensor drilled into tree trunks at chest height to measure transpiration by taking the temperature difference across a heated element to determine the amount of sap flow.
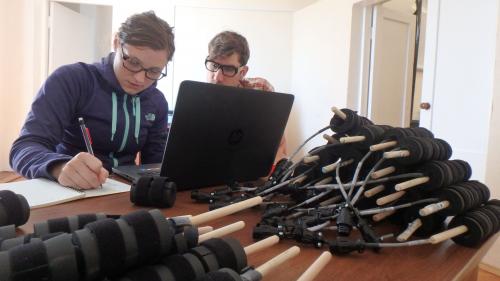 Mike Loranty and Heather Kropp preparing equipment for a day of field work
Normalized Difference Vegetation Index (NDVI) The NDVI is the measure of green space in a localized area which is determined by measuring the amount of light being absorbed and reflected within sight of the monitor. This can also be used by satellites to measure vegetation index on a global scale.
Temperature and Humidity sensor This sensor will record ambient air temperature and the amount of water vapor that is in the air in the data logger mounted close to the ground.
Radiometer The radiometer measures the amount of longwave and shortwave radiation that is moving in or out of an area. Short wave radiation comes in the form of electromagnetic rays from the sun, and when then the rays are absorbed by the ground they are re-released as longwave rays back out of the energy budget system. We currently have our radiometer attached to the top of a towering 8+ meter (27 feet) tower above the canopy and another one, for comparison, installed 1 meter off the ground. Both are connected to a data logger that will record throughout the season.
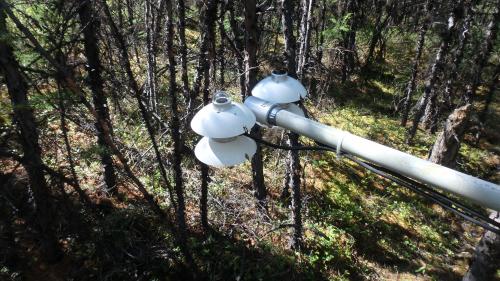 Close up of the radiometer. This one is looking at the understory of the forest at one meter off the ground
Heat Flux plates Like the radiometer, the heat flux plate measures the amount of heat moving vertically through the ground, which will indicate whether or not the ground is thawing or cooling and at what rate this is happening. This piece of equipment is placed in the ground approximately 5-8cm deep, just below the moss layer in the active layer of soil.
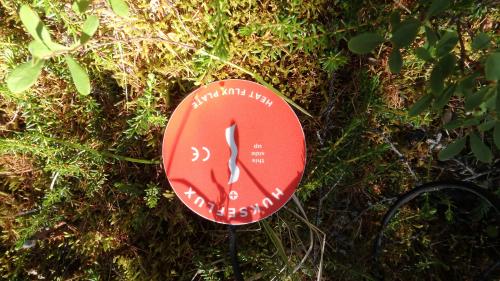 Heat flux sensor plate is placed 5 cm in the ground just at the top of the active soil layer
Instrumentation tower Most of the instrumentation is mounted to a 8+ meter (27 feet) tall tower. The tower was surprisingly heavy and definitely difficult to erect because of its length. A lot of preparation went into the design before we stood it up, mainly because we would not be able to access the instrumentation once it was raised. We measured it carefully and tied off our braided metal guidelines before the big push. This tower is a huge improvement over the makeshift tree/ tower that Loranty used last year. Needless to say, he was happy with the outcome.
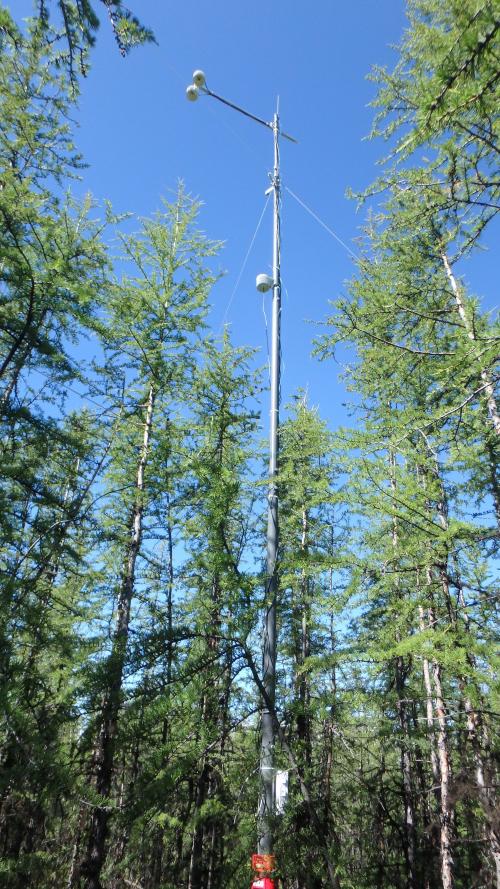 Looking up the 8 meter tower at the radiometer, temperature and hundity sensors
Once all the equipment is up and running we will monitor it closely to make sure that it is reading data the way it was programmed to do and troubleshoot where necessary. In the meantime we will begin taking other sorts of samples and measurements throughout the surrounding area of Cherskiy.
So what are all these measurements for?
The purpose for all of this equipment is to see how the vegetation in the boreal forest is affecting the permafrost layers in this region of the Arctic. Overall, the measurements taken are designed to help us better understand the details of the energy balance. In other words, we are looking at the amount of energy coming into the ground and measuring how much is moving in and out. In theory, they will be equal and there will be no net gain or loss of energy. However, if there is some sort of change or disturbance in the interface with the ground, there could be a change in temperature at the local and global scale. For instance, an increase in greenhouse gases could be that disturbance and would then be cause for a rise in temperature on a global scale.
These measurements are important because of all of the carbon locked up in the permafrost layer beneath the soil in the arctic regions. Currently, this carbon exists in the form of frozen fossils and plant remains that have not yet decomposed. If more energy is coming into the ground, it will warm up the permafrost and thaw it. That stored carbon will be re-released back into the atmosphere in the form of greenhouse gases. Our study is trying to pinpoint where and under what conditions can we find these disturbances in the energy budget. (See the energy budget diagram I created for location of the instrumentation and flow of energy.)
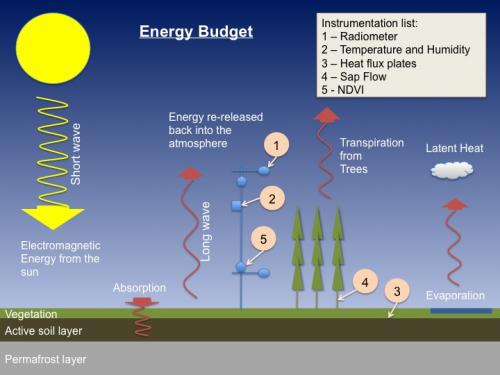 Energy Budget and Instrument location diagram

Comments