So just what is the Deep Roots team doing while we’re up here (or more scientifically, what is the experimental design)?
Choosing a representative sample
The tundra behind the field station represents tundra that is fairly typical of what is found here in the North Slope of Alaska. The land has been approved by the Bureau of Land Management for scientific use, so it’s just a matter of determining what plots are approved by the field station for the team and choosing a representative sample. For this experiment, there were 8 plots of tundra that were used (truly 16, as 8 plots were assessed after 24 hours and the other 8 will be assessed in 2017) – 4 greenhouse plots and 4 control plots (shade houses were not used, as the question is about what could happen in a warmed environment). A quadrat is placed over an area of land that is considered “standard” and flags are placed in areas that will receive an injection of Nitrogen-15 which will later be identified in different parts of the plant.
 Drs. Hewitt and Genet lay down a quadrat on a control plot.
 After a quadrat is placed in a greenhouse plot, the thaw depth is measured.
 Colored flags are placed within the quadrat to mark the injection points.
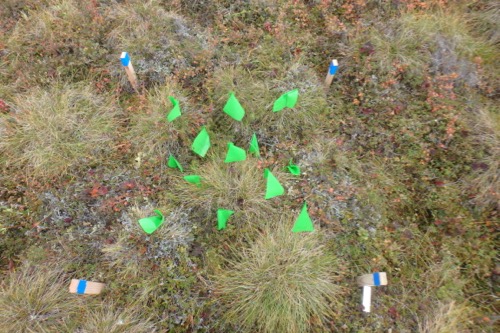 Colored flags are placed within the quadrat to mark the injection points.
Qualitative and Quantitative Data
Any good scientist knows that keeping track of all observations is vital to the analysis of your data. Each plot has a unique location, a community of plants, thaw depths, and (at the time of harvest) size and dimensions of the soil cores removed. In a previous post I profiled some of the plants that are found here and posted a picture of me taking a thaw depths.
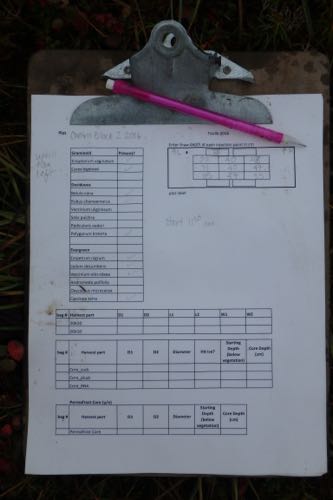 Qualitative data about the plant species observed in each plot and quantitative data about the thaw depths at each injection point is recorded while in the field.
Each of the data sheets is identified by plot name (Control 1 vs. Greenhouse 1, etc) and year collected (2016 vs. 2017). When the plots are harvested, each sample is given a unique code – one for the active layer retrieval, one for the soil core retrieval and one for the ice core retrieval. These samples are then further broken down based on the type of analysis they will receive.
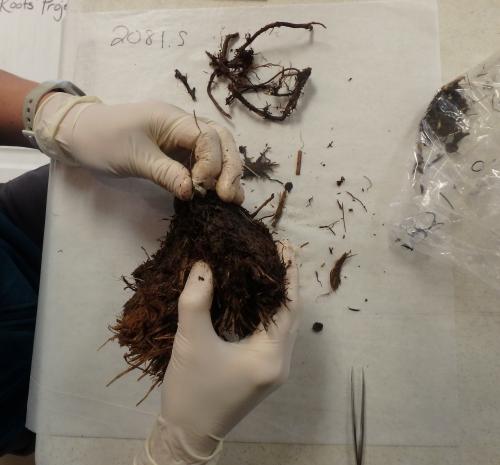 A below ground sample undergoing the first level of root identification. Note the number in the upper left hand corner to keep track of its plot location.
Isotope Analysis
The day after all of the plots were identified and flagged, we headed back out into the field to inject Ammonium Chloride (NH4Cl) into the soil for isotope analysis. The 15N isotope has a special “signature” which can be identified with complex scientific equipment to determine how far the Nitrogen has traveled throughout the roots and other parts of the plant in a 24 hour period (8 other plots were also injected and will be harvested 1 year from now for analysis).
 Metal tubes are inserted to the depth of the permafrost layer so that the isotope can penetrate deep into the soil and be taken up by plant roots.
 Dr. Hewitt prepares a syringe of Ammonium Chloride is for the soil injection.
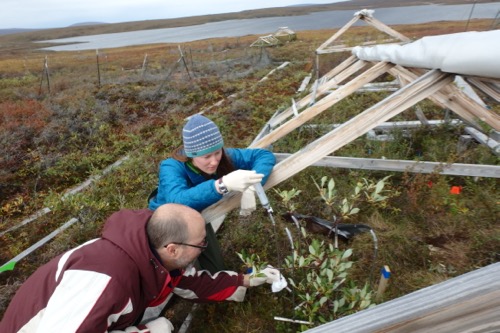 Dr. Hewitt injects the Ammonium Chloride into one of the tubes. Dr. Taylor steadies the tube as sometimes the soil is waterlogged and the isotope can bubble back up into the tube.
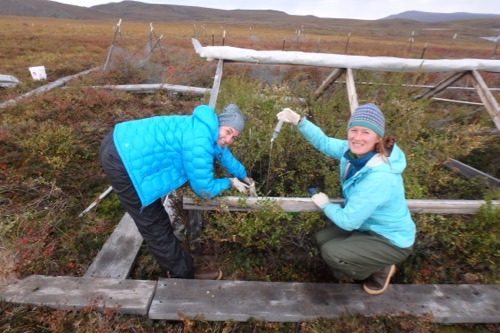 I have to hold back any foliage to prevent any isotope ending up on the leaves of the plants so as not to cross contaminate the sample.
Check out the video below of how Nitrogen is injected into the Tundra Soil.
Why Inject Labeled Nitrogen?
You’ll find that out in my next journal post – stay tuned!


Comments