Journal Entry

Packing up

In less than a week, we will be off to Norway to begin our Arctic adventure! It’s been a busy week finishing up the school year and making preparations for the trip. I thought I’d post a short journal post today about all the gear!

I got to spend Friday with Julie, Zander and Kelly as the scientific gear was checked, tested and inventoried in preparation for shipping. We’ll ship most of the science equipment directly to Longyearbyen, in Svalbard, where it should be waiting for us when we arrive there on July 6.
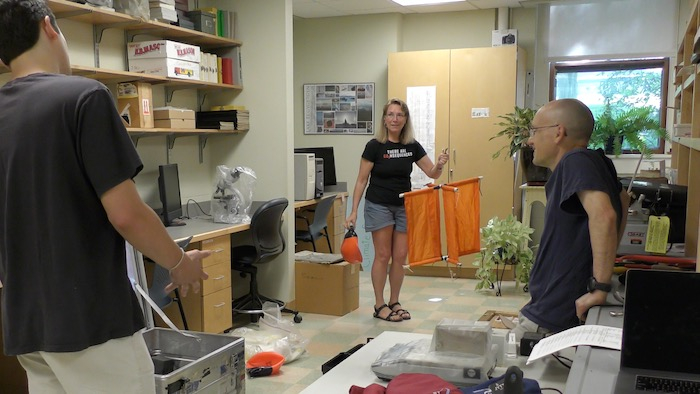
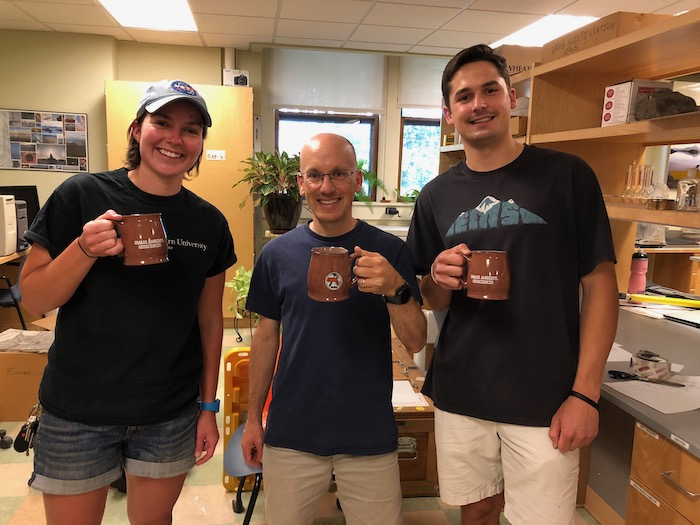
In the lab before packing upJulie showing us the “drogue” we used to determine water velocity back in 2011. Mark and the students in the UMASS labKelly, Zander and I proudly showing the awesome UMASS Geosciences coffee mugs that Julie gave us!
Going to the lab to organize the equipment gave me a much clearer picture of exactly what we’ll be doing. There are 5 main sets of data we need to be prepared to collect as we focus our study of the glacier, and, in particular, on the upwelling plumes that emerge from the glacier face:

Bathymetry - Mapping the seafloor depth in the fjord. This will help us understand how the glacier is receding and how sediment deposition patterns are changing over time.

CTD (“Conductivity / Temperature / Depth”) - Taking an array of oceanography data around the glacier face will help us understand how the upwelling plume behaves. Conductivity will tell us the salinity, and the CTD unit can also measure the turbidity (the cloudiness) of the water. We might be able to create a sort of 3-D map of the fjord which can be used to visualize the interactions between the glacier face and the ocean.

Current Velocity Meter - We’ll be measuring the speed and direction of the water coming off the glacier face at the water surface.

Water Sampling - collect samples of water at varying depths. We will use a vacuum pump to filter the sediment out of the water, so we can characterize how sediment is flowing through the water.

Drone - Get aerial video and photos of the area in and around the upwelling plume, as well as other features of the glacier and surrounding area to document our work.

Each of these has its own set of instruments, batteries, cables, etc. All in all we packed up 5 large boxes to be shipped. Tomorrow they will leave UMASS and get shipped to Longyearbyen.
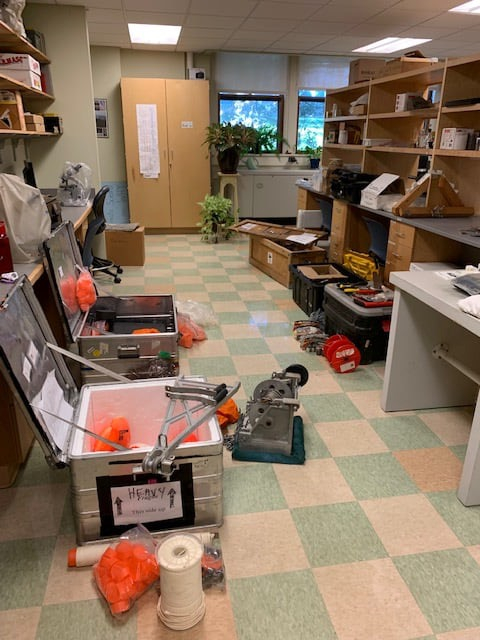
Scientific gear in boxesThe many crates filled with science equipment almost ready to be shipped.

Documenting our Expedition

One of my main roles in this adventure is to keep documenting our work. I intend to collect lots of video, photos, and of course drone footage. I am in the midst of packing up my own gear, and I’m a bit overwhelmed by the sheer number of batteries, cords, mounts, etc.

Because most of the batteries are Lithium ion batteries, they must be taken in my carry-on. Fortunately I was able to squeeze it into a bag just small enough to meet the Delta Airlines requirements.

But here’s a fun little shot of all the various electronic equipment I’ll be taking, including the drone, video camera, GoPro, iPhone, iPad, backup hard drive, backup battery, tripods, and various cords and adapters:
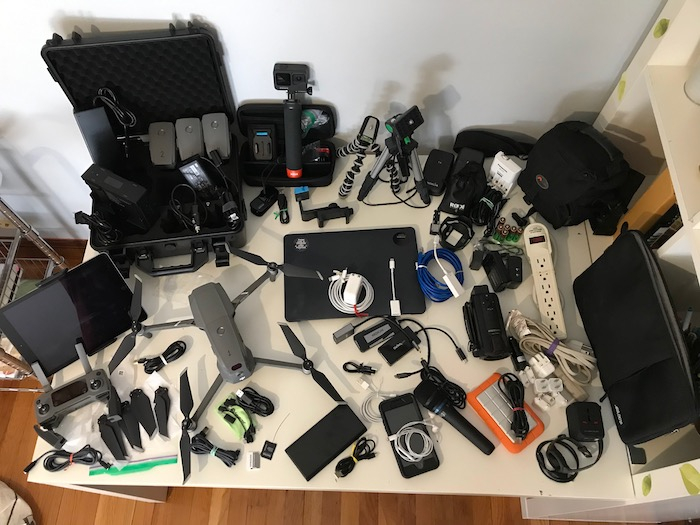
Array of electronic equipmentAll the various electronics I’m taking to Svalbard to document our work.

I’ve been taking some time to learn how to fly the drone. It’s so much fun to fly! It definitely takes a lot of practice to master the various movements of the drone, which can move independently from the camera.

Here’s my first attempt at taking a wide panoramic-type shot of the region around Millennium Park in Boston. You can see the Charles River, and at the end you can make out the skyline of Boston. I obviously need more practice to learn how to smooth out the motion of the drone and the camera, so thankfully I have this coming week to continue practicing!

Comments

Judy Fahnestock

WOW! That is a lot of electronics! It seems that your carry-on bag is going to be a bit heavy! Have you weighed just your electronics? How's the rest of your packing going? When does/did school end?

Mark Goldner

Yeah, the electronics will completely fill my carry on bag. I measured, though - I can meet the maximum size set by the airline! But it's heavy...
We finish school tomorrow, which is when my packing will begin in earnest!

Janet Warburton

Hi,
Great journal Mark! Thanks for sharing this. That is an amazing amount of electronics (as Judy said). Does any of that equipment get charged using solar power?

Looking forward to seeing all that equipment in action!

Cheers, Janet

Mark Goldner

No, unfortunately I don't have the ability to get this stuff charged using solar power. Bringing a solar panel would certainly put me over the weight limit! And, although we get 24-hour daylight up in Svalbard, the angle of the Sun is pretty low, so it's probably not super efficient.

Charlotte Pappas

Hello Mr. Goldener,

It was interesting learning about all of the different types of equipment you are bringing on your trip.
One piece of equipment that was particularly intriguing for me was the CTD device. I have personally never heard of it before, so I had wondered how scientists are able to find the temperature of ocean water, and I assumed that they used a thermometer that they put in the ocean water they are measuring. Therefore, when I learned about the CTD device, I could better visualize how scientists find the temperature of ocean water, as I looked up a picture of one, and it looks like it has many sensors, which I found could be used to measure ocean water temperature.

Furthermore, I also find it interesting how scientists can use the data collected from this CTD device to help them create 3D maps of the measured area of ocean water. I cannot imagine how creating a 3D map of an area of ocean water would work, but I am predicting that it could be created by making a computer image of the ocean water section, and then, using different colors to represent different measures of data that was collected.

Finally, one idea and concept that I am wondering about after reading this post is how are the sensors of the CTD device able to measure so many properties of ocean water? Another idea and concept that I am wondering about after reading this post is how is your team planning on creating the 3D map that visualizes the interactions between the glacier and the surrounding ocean, and is there a specific device that you are planning on using? One more one idea and concept that I am wondering about after reading this post is how does taking data about the temperature of the surrounding ocean of a glacier help you better understand the properties of the glacier?

That is all of my wonderings and ideas for now.
Charlotte

Mark Goldner

Hi Charlotte! Thanks for reading my blog and for posting such a thoughtful comment!

You are right, the CTD instrument is an amazing piece of equipment because it has so many sensors and can measure so many characteristics of the water at once. It's a very standard piece of equipment on any oceanography expedition. Your prediction is correct! We hope to put the data into software (such as a program called MatLab) which can create the graphs you described - with colors to represent different ranges of temperature, salinity, etc. Here's a link to an image created in 2011 by student Daksha Rajagopalan that shows one section of the ocean; this will give you an idea of the kinds of maps we hope to create (this one is only in 2-dimensions but you could imagine stacking up a bunch of these into a 3-D visualization). What's cool about this one graph is that you can see how the water is cooler on top, warmer below, and then much colder below that. This represents colder water coming in from under the glacier (from what is called an upwelling plume), and warmer water from the Atlantic Ocean coming in under that. Then, the much colder water underneath that is colder ocean water that doesn't mix as well with the water from the Atlantic. If you recall what you learned in 6th grade about density, you can see the effects of density really clearly: The less dense freshwater from the glacier is on top, the more dense (but warmer) saltwater under that, and then the most dense cold saltwater on the bottom.

Hopefully this give you a glimpse of the kind of data analysis we will be doing. Then, we can try to look at data over time - from several years ago compared to now - and see what kinds of changes have occurred with the water coming off the glacier. From there the scientists will be able to create models about how the glacier is changing.

I hope that answers your questions! More is obviously to come as we get into the actual data collection next week. Right now we're stuck in quarantine. (Which, if you read today's blog post, is not really too bad!)

Elsa Pullano

Hello Mr. Goldner,

Your trip sounds very interesting, although that is a lot of equipment to carry! I really liked watching the video of the drone shot, it looked really good for a first try! You mentioned that when you went to the lab you had a better picture of what you were going to be doing. Did seeing the equipment change your thinking of what you were going to do there, and if so, how? Who decides what equipment to bring, and is there any equipment that you wanted to bring but couldn't?

Elsa

Mark Goldner

Hi Elsa, thanks for your questions! Because I had done this work ten years ago I was familiar with most of the equipment. So I had a pretty good idea of what we were going to do before I went into Dr. Brigham-Grette's lab. But it was great to help pack everything up so I can re-familiarize myself with all the pieces of equipment - after all, it had been ten years since I have used this kind of equipment!

Dr. Brigham-Grette was the one who decided what to bring. There were some items that I think she might have wanted to bring along to help us better understand the glacier system. For example, it would have been nice to have a better water velocity-measuring system to monitor how the water is flowing off of the glacier face. We did end up using a simple device called a "drogue" (see this journal for an explanation and image) but it doesn't give the kind of information we would have liked.

Add new comment