Since we left on Friday, we have spent the last 4.5 days in transit - sailing to the first of our test stations. Once we reach that point, science operations will happen 24 hours a day. People will be assigned watches (work shifts), and everyone will become a whole lot busier.
Sunday night we met as a science party (for most people, not as fun as it sounds - for me, I'm all in) to hear an overview of our science objectives. Chief Scientist Dr. Igor Polyakov and Chemistry Team Leader Dr. Laura Whitmore from the University of Alaska Fairbanks gave us an overview of the NABOS (pronounced nah bus) project. NABOS stands for Nansen and Amundsen Basins Observational System. The names refer to geographical places in the Arctic Ocean that were named for famous polar explorers (see my 9-14-21 post for an Arctic geography refresher).
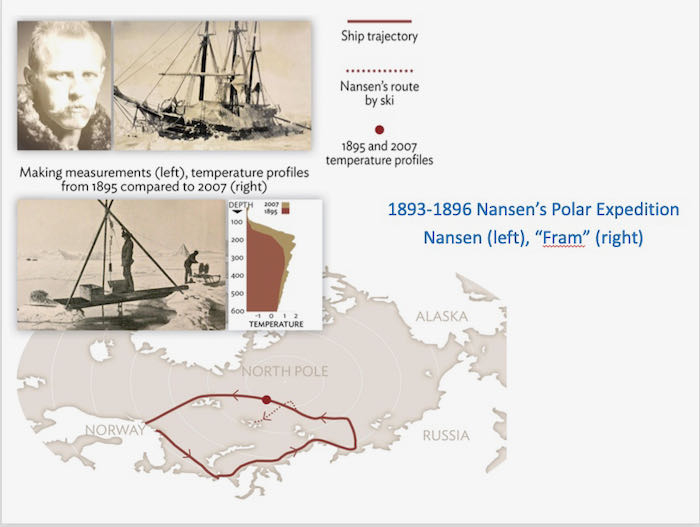
The project started in 2002, but it actually has its origins much further back. Scientists have been exploring the Arctic since the mid-1800s and collecting some of the same types of data. Igor presented the slide below showing Norwegian explorer Fridtjof Nansen's expedition on his ship, the Fram (more about this in a future post). If you take a look at the graph, Igor compared Nansen's data from 1895 with the NABOS data from 2007.
 Nansen's Arctic Expedition Routes. Compare the temperature data from 1895 to 2007. Similar trends, but currently warmer. (Image courtesy of Igor Polyakov, UAF).
The purpose of the NABOS expeditions are to understand the role of the ocean in the Arctic, especially the role of changing sea ice conditions.
The data represents observations that are also key to understanding climate change.
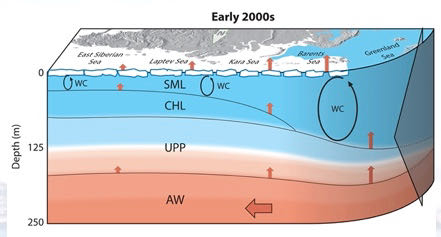
If you could slice the Arctic like a piece of Portillo's chocolate cake (for any non-Chicagoans - it's one of the best) and look at the chemical composition, you would see it has layers with different properties. The top layer is ice (fresh water), the next layer down (~0-50m) is the SML (summer mixed layer). It is a mixture of fresh and salty water and is warmer than the layer below because of atmospheric warming in the summer. Below that from ~50-100m is the CHL (cold halocline layer). This layer is salty and acts as an insulator, keeping heat from below from rising and melting the ice from the bottom. The UPP (upper halocline layer) is a mixture of saltier water, and is directly above the AW (Atlantic warm layer) - the warm water coming into the Arctic Ocean from the Atlantic Ocean. Some mixing happens during WC (winter convection which brings warmer water to the surface. The color coding shows temperature variations - blue is colder and red is warmer.
 Layers of the Arctic Ocean in the early 2000s. See the text for explanation. (Image courtesy of Igor Polyakov, UAF)
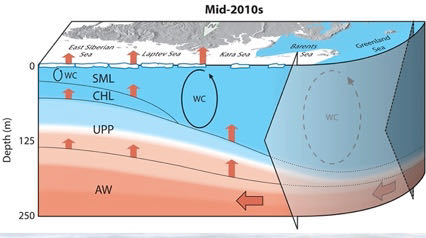
In a stable environment, salt water is more dense than fresh water, so it stays at lower depths and thus traps much of the heat below. Comparing the image from the early 2000s with the image created from data from the mid-2010s shows that the layers have shifted upward - meaning more warm Atlantic water is reaching the shallower depths - and eastward - conditions found in the Barents Sea were being seen in the Kara and Laptev Seas, thousands of miles to the east.
 Layers of the Arctic Ocean in the mid-2010s. Compare the thickness of the layers and especially how far East (left) the Winter Convection process have shifted (Image courtesy of Igor Polyakov, UAF)
Continuing to collect data and to document changes in the Arctic Ocean is the purpose of these expeditions. I am very fortunate to have the opportunity to participate in the research and to communicate these changes.


Comments
Add new comment