To The Divide!
After a down day for some repairs to the Airborne Topographic Mapper and staying on the ground to avoid some strong cross winds, our mission today was to measure the ice near the West Antarctic Ice Sheet divide, known as WAIS Divide. A divide is a topographic high that separates two drainages or drainage basins; the Continental Divide in the US separates the drainages to the Atlantic and Pacific Oceans. In Antarctica, the divide separates two glaciers that flow toward different seas.
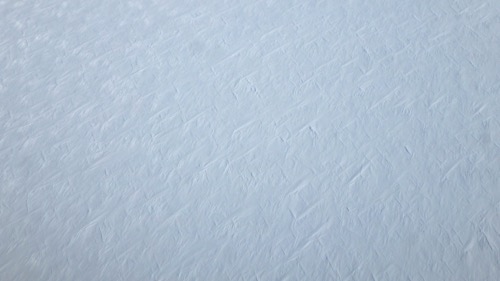 The ice surface at the divide has interesting perpendicular lines that could be wind direction, or stretch marks of some kind.
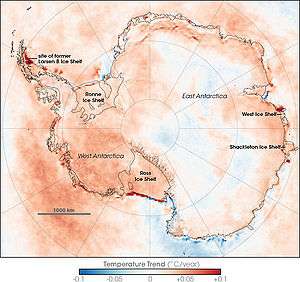 This temperature map shows how relatively warm the WAIS is.
Isostatic Rebound
The WAIS is a marine-based ice sheet, parts of it are located below sea level. Its edges stretch out into the Ronne Ice Shelf to the north, the Ross Ice Shelf to the southwest, and the Thwaites and Pine Island Glaciers to the west. Remember, we studied Thwaites and PIG last week. How can an ice sheet sit below sea level? Because of the enormous mass of the ice sheet, the bedrock below the ice is pushed down. This is called isostatic depression. Imagine how much pressure from above this must take! It is thought that the bedrock below the 2.2 million cubic kilometer ice sheet is depressed by as much as 0.5 to 1 vertical km. Wow! It is important to understand that isostatic depression is a temporary condition, and as glaciers melt, the rocks rebound. This will come up in a future discussion related to why sea level rise is expected to be so aggressive along the North American shoreline.
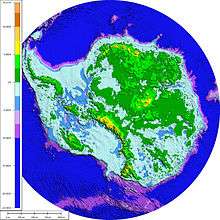 The bedrock map of Antarctica shows how the WAIS is below sea level.
Vulnerability
The WAIS is of real interest because of its vulnerability. With its belly on the relatively warm ocean water, it is heated from below, allowing it to melt and flow much more quickly. As we know from last week, the PIG and Thwaites Glaciers are responsible for large amount of sea level rise, and as the accumulation zone for these glaciers, the WAIS is feeding its downstream partners quickly. The WAIS is estimated by CryoSat-2 data as losing 150 cubic kilometers of ice per year and may be headed toward collapse. Additionally, changes in air circulation may be bringing warmer ocean water up in contact with the glacier leading it further toward collapse. Since so much of WAIS is below sea level, it is extremely vulnerable.
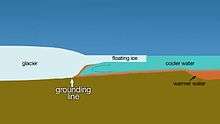 Diagram showing the vulnerability of ice over water.
WAIS Divide Ice Cores
Ice coring at the WAIS Divide completed drilling in 2011, resulting in over 3,000 m of high time resolution and dating accuracy with ice as old as 67,748 years old. By flying this mission today, we can cross correlate our findings with those of the cores, as well as with IceSat-1 that had flown part of this flight path in the past. When IceSat-2 flies over this area in a few years, we will have at least four records of how the WAIS is changing.
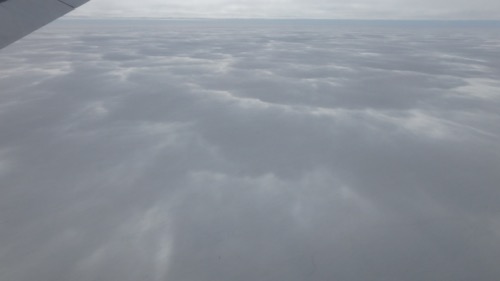 Low fog cast shadows on the ice.
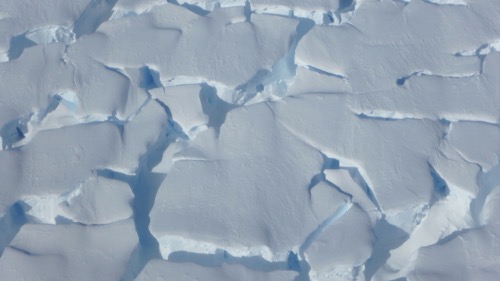 Deep crevasses just past the grounding line tell us we are on the Thwaies ice tongue.
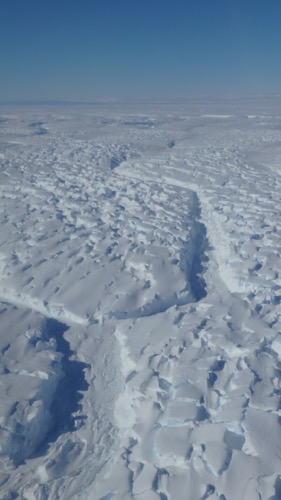 Large crevasses, at least 200' wide, break the tongue into large pieces.
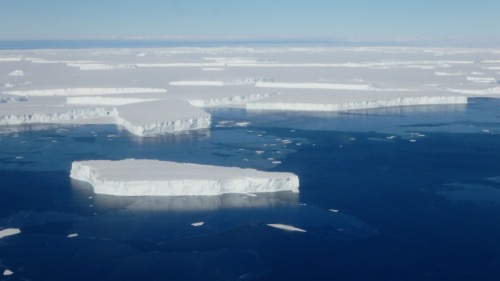 Tabular icebergs can be connected together with much thinner sea ice.

Comments