Yesterday, we collected our second set of CTD (Conductivity, Temperature, Depth profile) data and dropped another float in the water that will immediately begin the cycle of diving and resurfacing for the SOCCOM (Southern Ocean Carbon & Climate Observations & Modeling) project. However, all of this activity took place starting around 5:30pm, which is well past my 4:00 bedtime. Does anyone know why I'm going to bed at such a ridiculous time?
Linda Welzenbach, a Science Communication Specialist in the Department of Earth, Environmental, and Planetary Sciences at Rice University, was onboard the Palmer last January on its expedition to the Amundsen Sea and maintained a blog about her time on the ship. She witnessed multiple deployments of the CTD rosette. She describes walking "into the warm and humid Baltic room, a large space with a noisy heater fan and floors damp from residual sea water. Next to the big black and yellow checkered door which opens directly to the ocean, the six foot tall CTD sits tethered to a strong steel cable that will not only carry this nearly 1000 pound instrument 3350 meters into the Amundsen Sea, but includes an information umbilical cord that receives data," which is immediately translated into graphs on the screen of a computer in the forward dry lab.
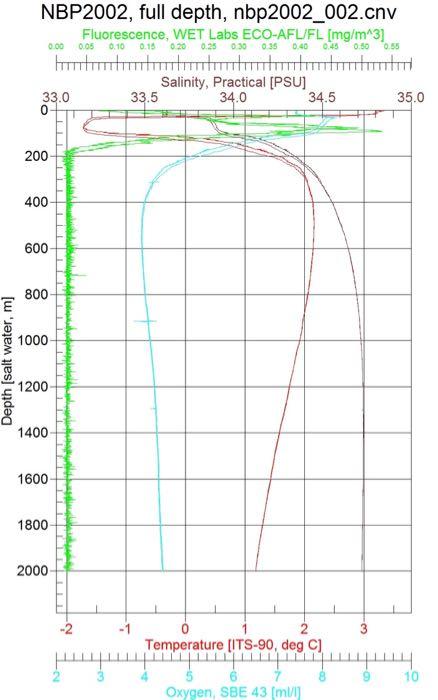
 Data on salinity, temperature, fluorescence, and oxygen from the water's surface down to 2000 meters collected via CTD by researchers onboard the R/V Nathaniel B. Palmer icebreaker in the Southern Ocean.
There is a lot of information in this graph, including two sets of data for each variable - one that the CTD collected on the way down, and the other set collected on the way back up. Fluorescence (the green line) is a measure of the amount of chlorophyll present in the water, and the fact that the levels are at zero below 150 meters shows that there isn't a lot of photosynthesis taking place at those depths. Water temperature (the red line) at the surface is just over 3.0˚C, dips as low as -1.8˚C at 90 meters below the surface and then increases to 2.0˚C. These changes might seem insignificant, but water that is 2.0˚C is warm enough to melt ice and shows the presence of the Circumpolar Deep Water (CDW) that is increasing the melt rate of the Thwaites Glacier.
RESOURCES FOR TEACHERS:
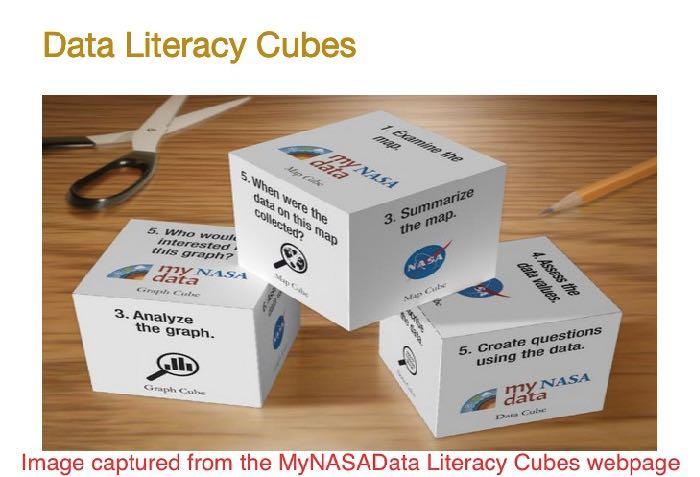
Complicated graphs like these can be challenging to interpret, but there are some great resources available to teachers trying to help their students understand representations of data. My favorite is the NASA Data Literacy Cube available on the My NASA Data website.
 Information on how to use NASA's Data Literacy Cubes to interpret graphs, maps, and data is available on the MyNASAData.gov website.
There are three versions of the Literacy Cube and accompanying questions - one set each for maps, graphs, and data. Additionally, each set of questions is available at four levels, depending on your students' abilities. Using the CTD graph above as an example, students would roll a die, and then work with a partner to answer the questions associated with that number.
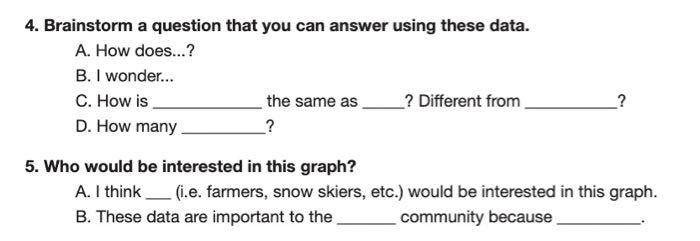
 For each number on the cube, there is a question type plus a set of sample questions that students could ask and answer based on the graph, map, or data they are interpreting.
Roll a 4 and you would brainstorm a question that could be answered using the graph. Roll a 5, and you'd be asked to consider who might be interested in the information contained in the graph. I think it breaks down the challenge of interpreting a complex diagram into manageable pieces. The BBC article on the Thwaites Glacier that came out on January 28, 2020 has a number of maps that could be used for an activity like this. Or you could use it with maps that show flood zones in your community - New York City makes its flood maps available on its Flood Hazard Mapper site.


Comments
Add new comment