For those of you out there unable to attend science class right now, there are plenty of ways to grow your science skills at home. Some of the things I wanted to do with my students when I returned from Antarctica could easily be done under the supervision of a parent - or perhaps be entirely self-directed by students themselves (which really doesn’t speak to the importance of my role as a teacher). Because weather is such a big part of our days down here, let’s explore some weather-related activities that can be done at home by students of a range of ages.
The book “Big Data, Little Devices” by Donna Governor, Michael Bowen, and Eric Brunsell released by the National Science Teachers Association Press – a digital copy is available for purchase and download here, provides detailed descriptions of scientific investigations that can be performed by students of all ages based on publicly available data. One that I really like is the Extreme Weather investigation, which involves using the NOAA Storm Events Database to research weather occurrences taking place over the past 60+ years. The database includes data by county and state for significant events such as hailstorms, tornadoes, dense fog, heavy rain, or extreme heat or cold. Data could be used to compare the number or severity of events in a certain location over time (with event data going back to 1950), or to compare data points in multiple locations in the United States.
 Big Data, Small Devices: Investigating the Natural World using Real-Time Data.
The lesson plan in Big Data, Small Devices says to first give students time to explore the types of information available in the Storm Events Database with no specific research question in mind, After becoming familiar with the structure of the database, students will need to develop an investigation question. Maybe they’d like to do a little research on their home town - how many hailstorms have occurred in Guilderland, NY since 1975? Or maybe they want to compare the frequency and severity of the same type of event where they live vs. where their best friend lives - how many extreme heat days have occurred in Brooklyn, New York and Chicago, Illinois over the past twenty years? Or maybe they want to look for changes over time - how many severe rain events happened the year my mom was born vs. in the year I was born? Here are some additional examples from Big Data, Small Devices:
• Have the number of deaths from extreme heat in the United States increased or decreased over the past 30 years? • Over the past 20 years in Wisconsin, which month has experienced the most heavy-precipitation days (rain and/or snow)? • Over the past five years, which has caused more property damage, tornados or floods? • Over the past five years, which county in Illinois has had the most floods? • Has there been an increase in heavy snow events in Massachusetts over the past 30 years?
There are so many possible questions to investigate - but keep in mind that a good question needs three components:
• A weather event or events • A location or locations • A time frame
Now is a great time for a parent or teacher to check the investigation question and confirm that it can be addressed with the information in the Storm Events Database. If the question is feasible, students can now research and present the results of their own investigation question. There are lots of options for what to do next. Students could:
• Draw a data table to collect and organize the results of the investigation
• Collect data and display them in a graph and, based on the data, determine a claim (that is, answer the investigation question)
• Suggest a cause for any patterns identified
• Create a poster that includes the investigation question, data table, graph(s), and conclusion, as well as images related to the weather event
• Hold a mini-weather conference with others in their neighborhood to show off the results and new knowledge
• Create a digital presentation with Google Slides or, use the Prezi website (for extra pizzazz)
• Search for videos that show what it is like to survive an extreme weather event, or talk to family or friends that might have witnessed one, and use this understanding to write a first-person narrative about what it would be like to live through an extreme weather event.
• Use the easel.ly website to develop an infographic, or picture-based informative flyer, that describes their results
• Use iMovie software on a Mac to make a movie trailer about the hazards of an extreme weather event (although you would have to spend some time acting out important scenarios - but honestly, what else are you really working on right now?)
• Use a stop-motion animation app (see a review of the process and get some app recommendations here to make a short video of the weather event
• Find out what steps one should take to be prepared for extreme weather in their community
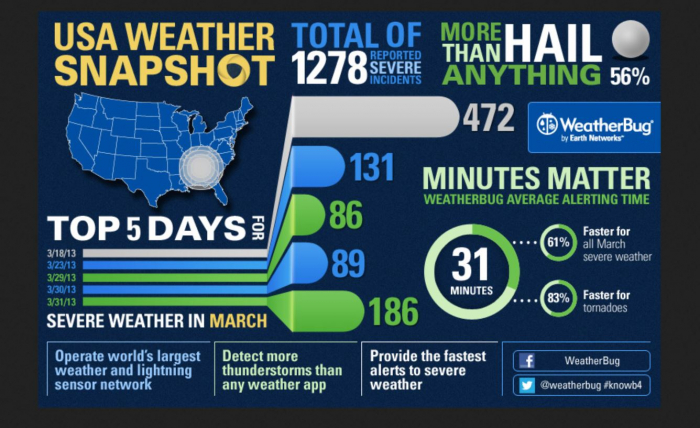
 Infographic on extreme weather events in the US, found at https://www.earthnetworks.wordpress.com/2013/04/09/infographic-march-severe-weather

Add new comment