Benefit of the Expedition to the Teacher
The PolarTREC expedition places the teacher in the role of student. All aspects of the expedition ask the teacher to stretch her mind and reach beyond her comfort zone. This stretch presents itself to the teacher in having to learn new technology, new science, new presentation formats, and meet, live and collaborate with new people. During the expedition, the teacher will learn to overcome her own limitations and learn to walk through the learning process much like her own students experience back in the classroom. After a PolarTREC expedition, the teacher can share more than the science with her students, she can share the rich experiences she has had with the people, the place and the natural world. Her enthusiasm will hopefully inspire and motivate her students to pursue interesting science related careers, and even a career in field research.
Description of My Activities
Each day during my expedition, I learned new tasks both in the field and back in the lab. I learned how the CiPHER and DryPHER research sites were set up to include replicates and controls. Most importantly, I learned how carbon flux was measured to quantify carbon release from microbial respiration, as well as carbon uptake from plant photosynthesis. I learned how to measure and record the changing depth to the permafrost and the depth to the water table. In the lab, I learned how samples and equipment must be prepared, maintained and properly processed and stored.
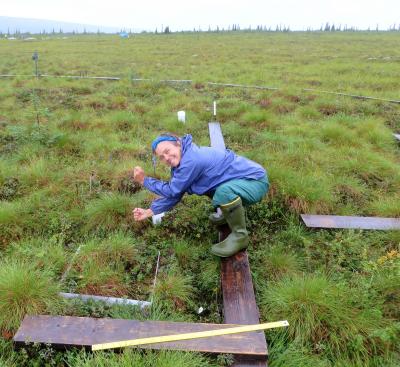 Karen Temple Beamish forces a thin rod into the tundra to determine the depth to permafrost. Photo by Karen Temple-Beamish.
Scientists downloaded and processed data each day and I learned how the scientists do a systems-check to insure that the data collected was within normal parameters. I learned how to do phenology counts, and how to measure biomass and species diversity within a study plot. I learned how infrared images can serve as proxies for plant productivity and health. I learned how scientists capture C14 samples from the soil respiration in the tundra, which tells the scientists how vulnerable old carbon stored in permarost is to microbial decomposition. I learned how water samples are collected and measured for dissolved organic carbon, another data set that helps the scientists track carbon pathways, as the tundra warms. I was even given the opportunity to help a scientist from a distant lab collect data on plant species diversity, and maybe even be a published contributor to the published data. Every day, I documented and interpreted my expedition experience with photographs and writing on the PolarTREC blog. In addition, I communicated the science experience during a PolarConnect event to an audience all over the world,
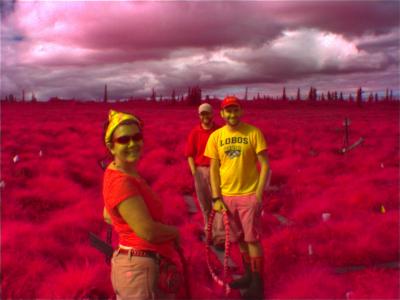 The research team as seen through the Normalized Difference Vegetation Index (NDVI) camera. Photo by Karen Temple-Beamish
including my home town of Albuquerque and as far away as Finland! While I was in Healy, Dr. Mauritz and I made an evening presentation at Denali National Park Visitor Center, as well as a daytime event highlighting activities and demonstrations to engage people of all ages and backgrounds.
The expedition experience was not all work! To truly understand the outstanding experience of a PolarTREC teacher, I must include the my recreation and relaxation. August is berry season and brought young grizzlies to our site, which graciously loped past us without stopping to sample the blueberry abundance while we worked. Our blueberry picking yielded home-made cobblers, muffins and even jam. We hiked in Denali National Park, enjoyed an outdoor BBQ, attended a local blue grass festival and many evenings of good food and good company.
Summary of How to Link This Experience in My Classroom
The field experience has encouraged me to set up lab and field experiments with my students that will simulate many of the same parameters that I measured in the tundra ecosystem, but within a high desert system, instead of a polar system.
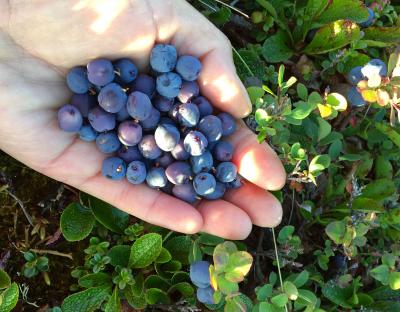 Karen picking blueberries for making jam. Photo by Karen Temple-Beamish.
We will set up mini soil systems and vary both moisture and temperature to see how carbon release may increase or decrease with these variables. I have soil moisture probes, temperature probes and carbon dioxide probes that the students can use. In addition, Dr. Mauritz and I are working on a set of graphs that present carbon flux data, depth to permafrost data and depth to water table from the CiPHER site. We intend to ask the students to analyze and interpret these graphs. In addition, my students will study the broader question of how climate change impacts polar systems. Each student has chosen a polar system that they study and then present their research using a story map (arcGIS). I am hoping that the student who has chosen the Denali tundra, will be able to use both my photos as well as some of the data that has been collected for CiPHER. The benefit of the arcGIS story map is that allows students to pull from data from many governmental research programs like NOAA.
What I expected to learn during my experience
I expected to learn how an experiment is set up, carried out and how data is collected and analyzed. The CiPHER project provided me with ample opportunity to learn and participate in research to understand how a warming, drying climate will impact the subarctic tundra system. The CiPHER team taught me the importance of experimental design in collecting and measuring the data that the scientists are interested in, especially data collected in a long term experiment, carried out over seven years.
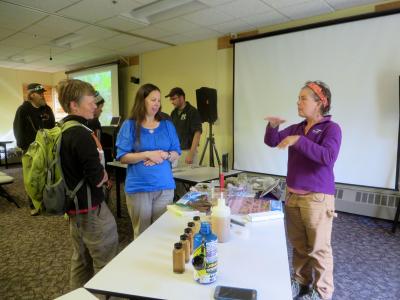 Karen presenting at the Denali National Park Visitor Center. Photo by Karen Temple-Beamish.
I learned how the scientists designed systems to minimize human impact on the site, set up protocols to manipulate the tundra system to mimic air and soil warming and soil drying, as well as how they constantly monitored and maintained the electronic systems, even in the dead of winter. I was given the experience of learning how to manipulate the data to create graphs that helped to analyze it. If we had had more time, I would have liked to do more of this, as it was exciting to see how raw data can be processed and transformed to show trends and patterns. For example, I was very surprised to learn from graphs of data collected from 2008 to 2013, that plant photosynthesis in the warmed tundra treatment has resulted in the tundra being a strong sink of carbon, rather than a source of carbon, during the summer plant growing seasons. Dr. Mauritz has told me that data collected since 2013 may reveal that plant photosynthesis may have peaked and microbial decomposition may now be causing the warmed tundra to release more CO2 than the plants can absorb, and therefore the warmed tundra may become a source and not a sink of carbon. The long cold winter months are still a mystery to the scientists, because it is really difficult to get data in the harsh winter months. They suspect that warmer soils might also lead to higher CO2 losses in the winter and are making continued attempts to improve winter measurements.
Concepts I would like to teach "better" or differently
The carbon cycle is a concept that my students do not seem to fully grasp. The movement of carbon through the atmosphere, pedosphere, biosphere and hydrosphere are critical concepts for understanding climate change. I am hoping that with the bottle biology project using soil decomposition experiments with varying temperature and moisture conditions, that the students will more easily understand the carbon cycle. Implementing better experimental protocols, and extending the project over a long period of time should help them begin to grasp and better reinforce the “unseen” carbon cycling.
Activities post expedition that the public should know about
The most important concept that I hope to share with both my students and with the public is how carbon cycling and climate change in the arctic connects to their lives in the desert. Activities that help me transfer this connection will be the focus of my outreach. I hope that the use of the probes and decomposition columns will engage and help the public see the carbon release. In addition, I hope to use graph interpretation as a key skill in developing student science analysis and so will emphasis this skill in the presentations that I make to other teachers and colleagues.
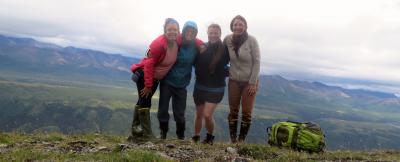 CiPHER Team photo on a hike in Denali National Park and Preserve, Alaska. Photo by Karen Temple-Beamish
| Attachment | Size |
|---|---|
| Download Report (993.24 KB)993.24 KB | 993.24 KB |
