Saturday hike
Saturdays here in Ny Ålesund are a little more relaxed. Instead of breakfast and lunch they serve a brunch from 10-11. The weather forecast was also dicey, so we planned to start our field work late, after brunch.
Xander, Kelly and I decided to get up early anyway and do a hike behind the research station towards a land-terminating glacier (a glacier that ends on land, and no longer makes it down to the ocean). We didn’t quite make it to the glacier because there was a shallow river crossing, and we hadn’t brought our waterproof “muck boots”. It was a really nice hike anyway, with lots of rocks to see and try to identify! We hope to try again tomorrow and bring the right footwear for a river crossing!
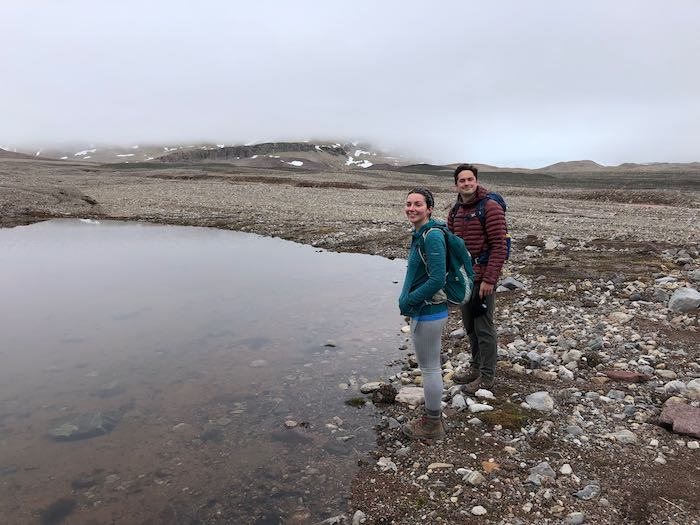 Xander and Kelly on our morning hike. The entire landscape is simply glacial debris - basically sediment of various sizes left by the glaciers that once flowed across this area.
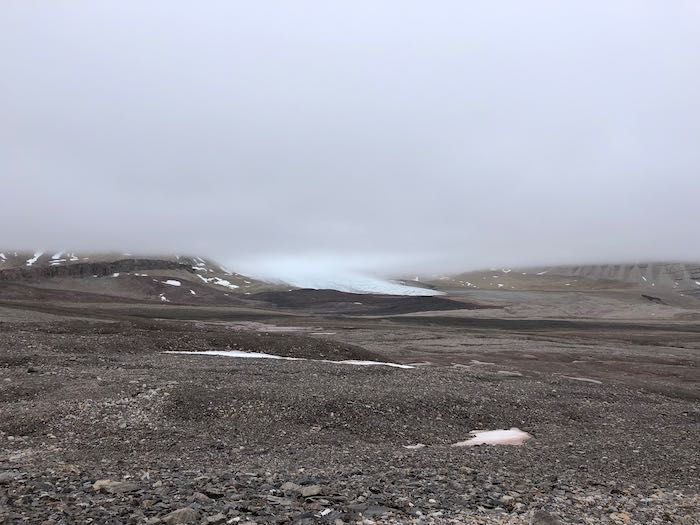 One of the land-terminating glaciers behind Ny Ålesund.
Out on the fjord - bathymetry and drone footage
It remained foggy until early afternoon, but the fog lifted in time for us to get down to the glacier face for some more bathymetric survey work. Before we go, we always have to suit up, which is a bit of a process! This short video taken a few days ago shows you just what a production it is to get suited up.
We continue to make a lot of progress doing the bathymetry.
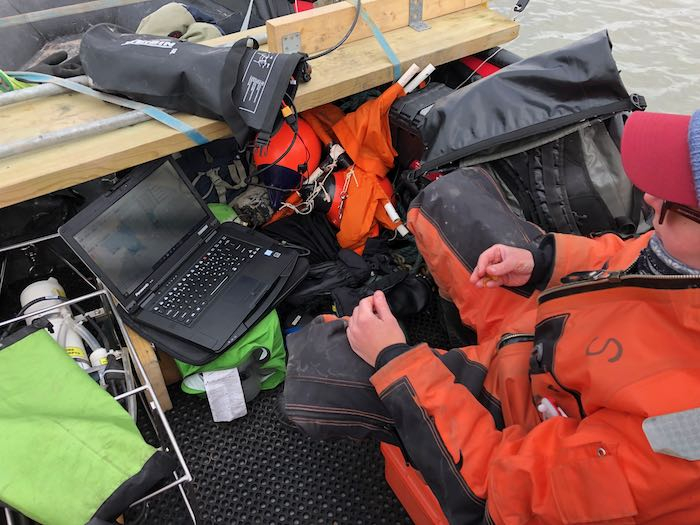 Kelly monitoring the computer while we do our bathymetric survey.
There were some very large icebergs which I was able to fly my drone around to get a new perspective on the icebergs. Here is a video compilation of some of the drone footage of icebergs that I took today. Do you notice the long grooves that run along some of these icebergs? These are called runnels and are where water flows up across the glacier face in an upwelling plume. (More on that to come in a future post!)
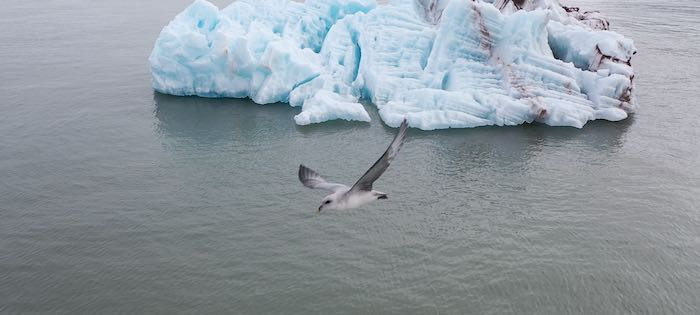 One of the large icebergs in front of Kronebreen glacier this afternoon, with a fulmar flying right in front of the drone!
What about all that CTD and water sampling?
I thought I’d write a little about the CTD work that we’re doing. Xander has really taken charge of analyzing the data, although we’re all pitching in with the data collection. The CTD, which stands for “Conductivity, Temperature and Depth” is designed to help us measure the salinity (from electrical conductivity) and temperature and various depths. This device is also equipped with a turbidity sensor which can measure how turbid, or cloudy, the water is. (This is valuable for knowing how much sediment is in the water.) Here is a video from earlier in our field work demonstrating how the CTD process works.
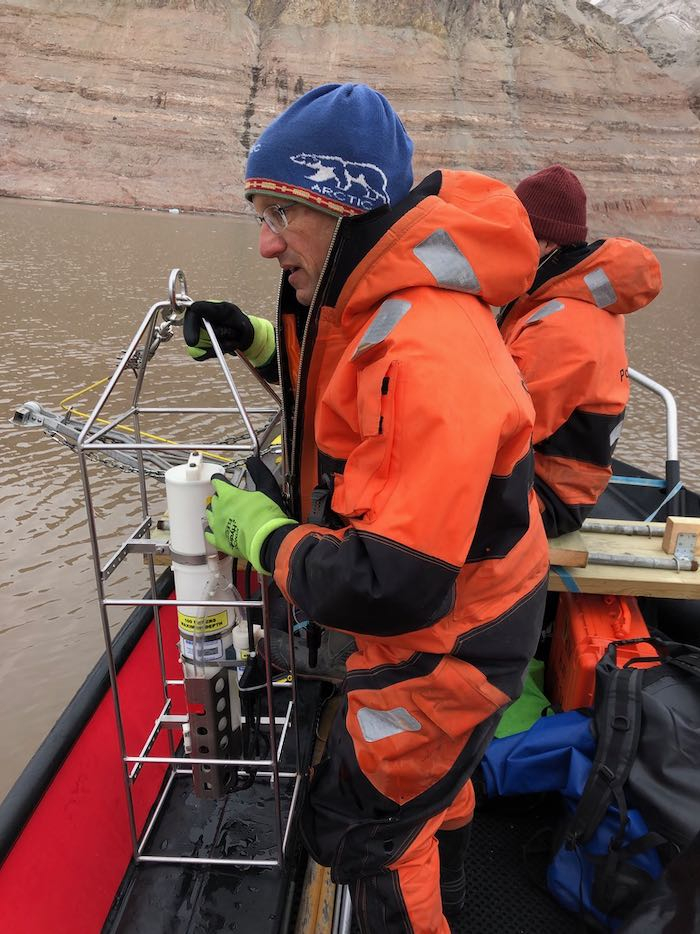 I’m getting ready to lower the CTD instrument into the water.
The turbidity sensor using something called OBS (optical backscattering). Essentially beams of light are sent out, and the amount of light that is reflected back to the instrument is correlated with the amount of sediment in the water (the turbidity). In order to make sure the measurements are accurate, the sampling device must be calibrated with a measurement of the amount of sediment in the water. So in order to do that, we collect samples of water at different depths and create a calibration curve.
The water sampling technique is pretty cool. There’s an open bottle with two caps that snap shut by a mechanical weight that is sent down a cable at the desired depth. In this video you can see Xander demonstrating how this device works. After the sample is collected, we bring it back to the lab where the water is vacuumed through a piece of pre-weighed filter paper. After the water is vacuumed through, the sediment is left behind. The sample is heated in an oven to boil off all the water, and then the paper is weighed. From there a measurement of grams of sediment per liter of water can be found. This is then used to calibrate the turbidity sensor.
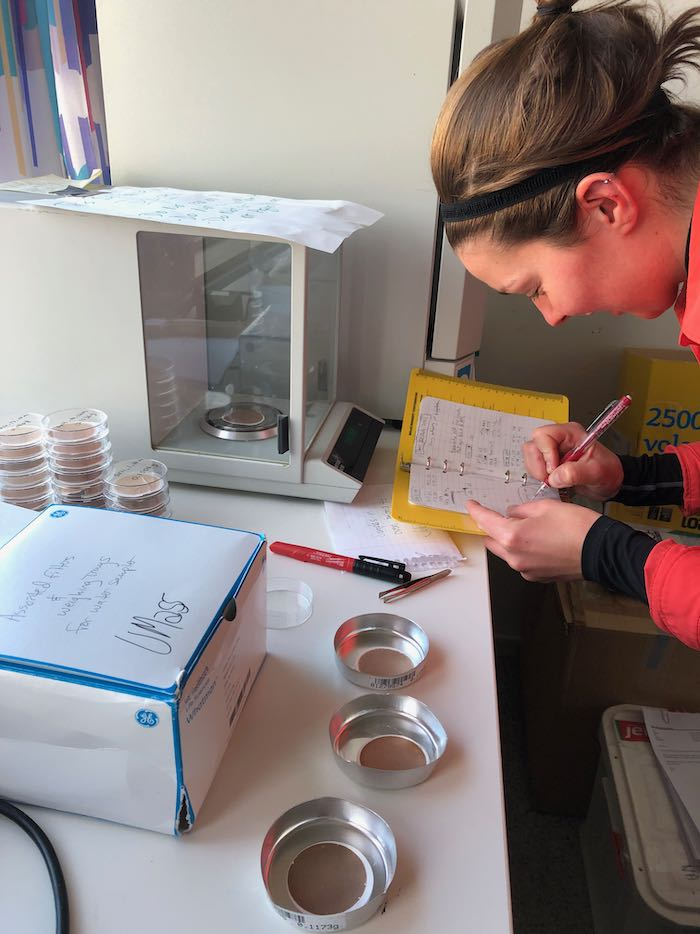 Kelly is weighing the sediment samples after the water has been filtered and dried.
I thought it was cool to look visually at the samples before and after pulling out the sediment. Some of the samples look completely clear, but when the sediment is pulled out you can see how brown they are.
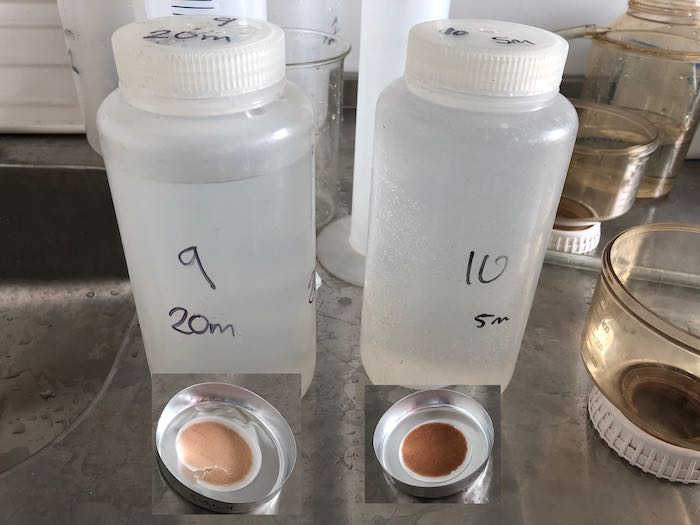 Water samples before and after filtering. Notice in this image that both bottles seem pretty clear. After sampling, you can see how there was plenty of sediment in the water. Also you can see that the darker one had a greater amount of sediment than the lighter one.
Then, I thought it would be interesting to arrange images of the dried filter paper by location and depth. In the image below (from a region in front of Kongsvegen Glacier), you can see the sediment at different depths along a line coming off the glacier face. This is a very simple way of visualizing the sediment plume as it comes off the glacier. It’s clear from this visualization that the sediment is darkest closer to the glacier, and closer to the surface.
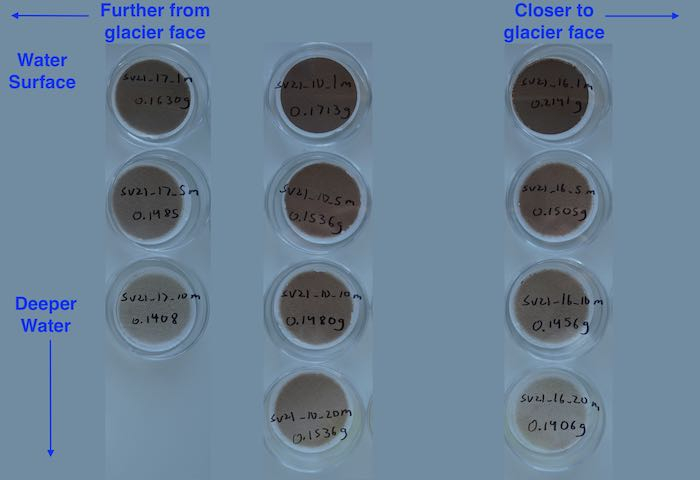 These images are from the water samples that were taken from different distances from the glacier face within a sediment plume, after they were filtered and dried. Basically, the darker the paper the more sediment is in the water.
If you look at a drone image of this sediment plume from Kongsvegen Glacier you can get a sense of just how much sediment is coming off the glacier. The plume is the brown water without icebergs coming up from the bottom left of the photo. There are no icebergs there because the water current of the plume is probably pushing icebergs out of the way. The water samples were taken from along this plume.
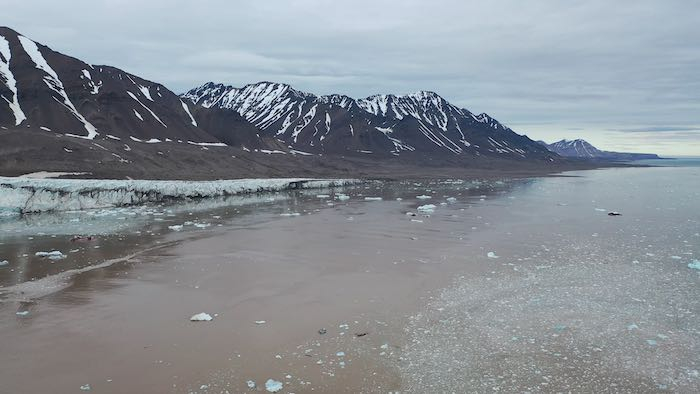 The sediment plume in front of Kongsvegen Glacier.
From the filter paper images you can get a sense of how the sediment stays on top. This is because of density - the freshwater coming off the glacier is less dense than the saltwater of the ocean, so it rises and stays on top. What I find interesting is how long it takes for all this water to mix!
The CTD graphs show the profile of turbidity, salinity and temperature. The y-axis (vertical) is depth from the surface (zero) down to 40 or 50 meters. There are 3 different things being graphed on the X-axis. The Green lines show Temperature, the Blue lines are Turbidity (how cloudy the water is) and the Brown lines show salinity (how salty the water is). (There are two lines because the CTD device collects data on the way down and again on the way back up.) I overlaid the filter paper images on top of the CTD images to help you get a sense of how the turbidity matches with the amount of sediment in the water. (Note that the scales are different in the two images!)
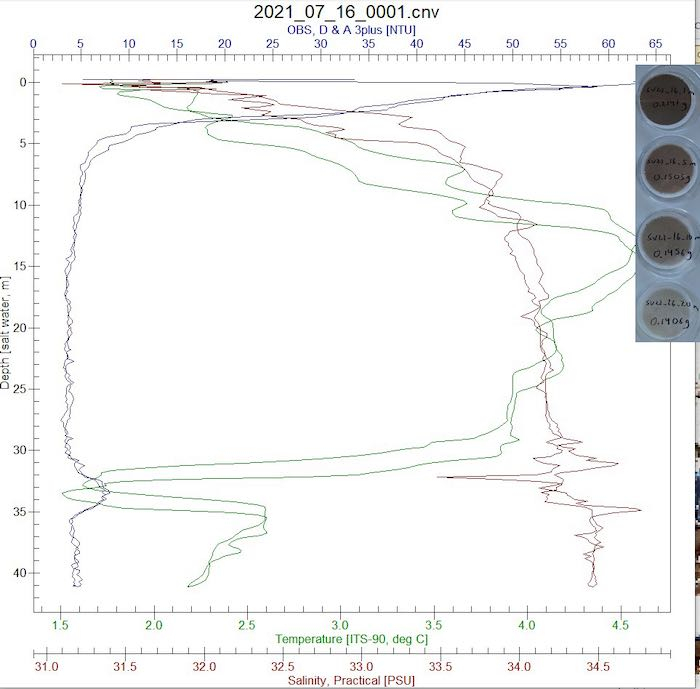 In this graph focus on the turbidity (Blue lines). Notice how it is more turbid (cloudy) at the top and then it goes way down. You can also see that in the images from the filtered water! Compare this to the next image which was from farther away from the glacier.
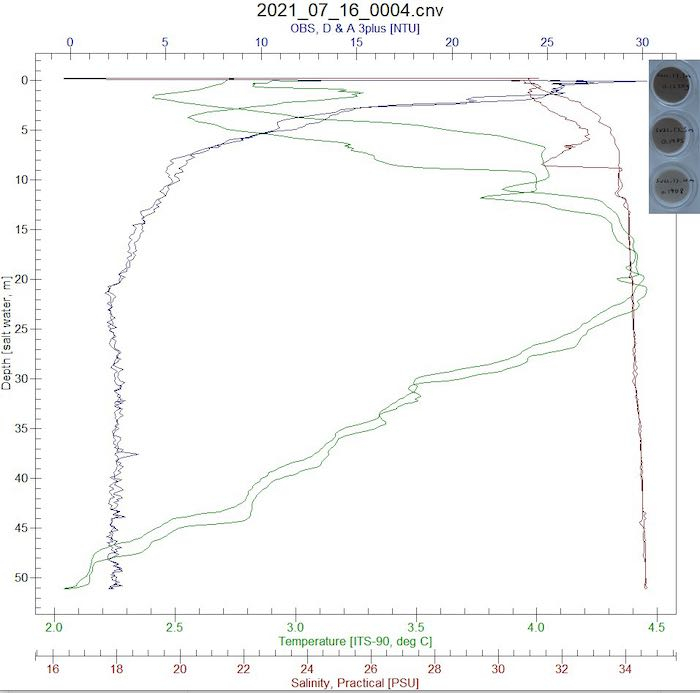 In this graph focus on the turbidity (Blue lines). Notice how it is more turbid (cloudy) at the top and then it goes way down. You can also see that in the images from the filtered water! Compare this to the previous image which was from closer to the glacier.
I know this can be kind of confusing at first, but the idea here is that Julie wants to take the CTD data from this year and compare it to previous years. In this way, she hopefully will be able to get a good sense of how the way sediment and meltwater flow off the glacier is changing over time.
Polar Connect Zoom Event!
A reminder that Monday at 3:30 Eastern Time we are hosting a live Zoom event! Anyone is invited to join us! You can register at this link. And, if you can’t make it, the event will be recorded.


Comments
Add new comment