Journal Entry

Saturday hike

Saturdays here in Ny Ålesund are a little more relaxed. Instead of breakfast and lunch they serve a brunch from 10-11. The weather forecast was also dicey, so we planned to start our field work late, after brunch.

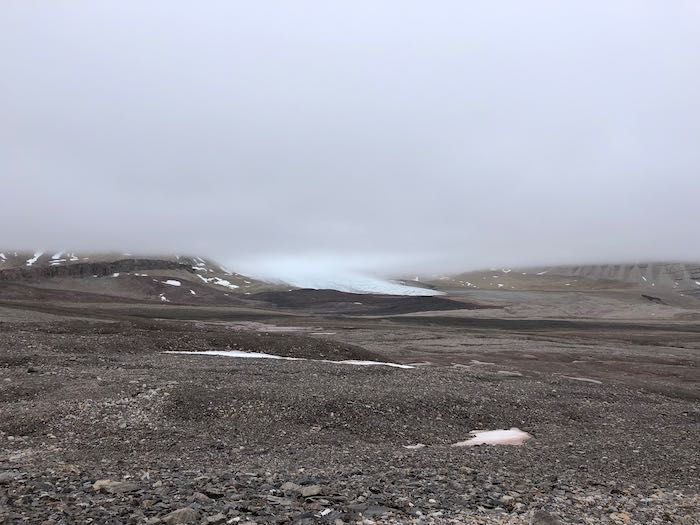
Xander, Kelly and I decided to get up early anyway and do a hike behind the research station towards a land-terminating glacier (a glacier that ends on land, and no longer makes it down to the ocean). We didn’t quite make it to the glacier because there was a shallow river crossing, and we hadn’t brought our waterproof “muck boots”. It was a really nice hike anyway, with lots of rocks to see and try to identify! We hope to try again tomorrow and bring the right footwear for a river crossing!
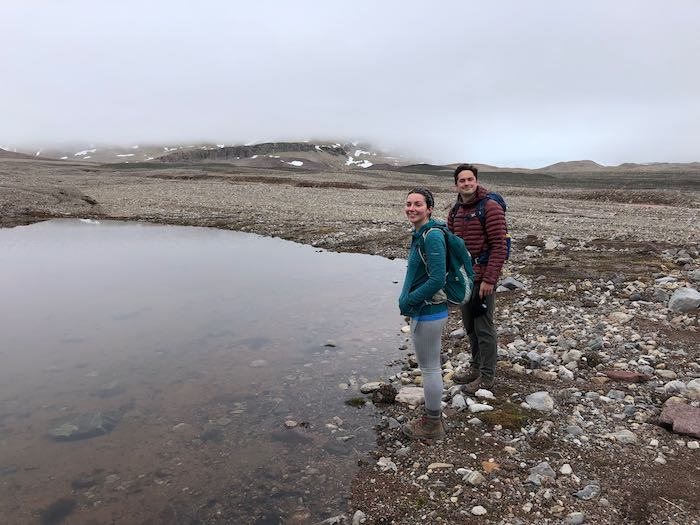
Morning hike along glacial debrisXander and Kelly on our morning hike. The entire landscape is simply glacial debris - basically sediment of various sizes left by the glaciers that once flowed across this area. Land-terminating glacier behind Ny Ålesund One of the land-terminating glaciers behind Ny Ålesund.
Out on the fjord - bathymetry and drone footage

It remained foggy until early afternoon, but the fog lifted in time for us to get down to the glacier face for some more bathymetric survey work. Before we go, we always have to suit up, which is a bit of a process! This short video taken a few days ago shows you just what a production it is to get suited up.

We continue to make a lot of progress doing the bathymetry.
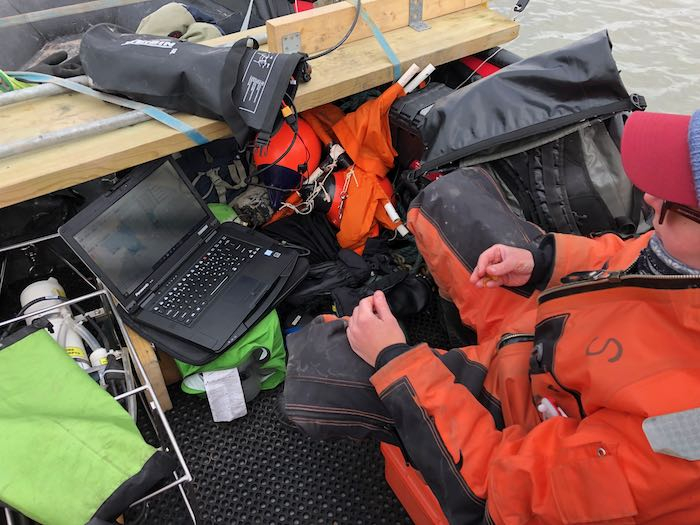
Doing bathymetryKelly monitoring the computer while we do our bathymetric survey.

There were some very large icebergs which I was able to fly my drone around to get a new perspective on the icebergs. Here is a video compilation of some of the drone footage of icebergs that I took today. Do you notice the long grooves that run along some of these icebergs? These are called runnels and are where water flows up across the glacier face in an upwelling plume. (More on that to come in a future post!)
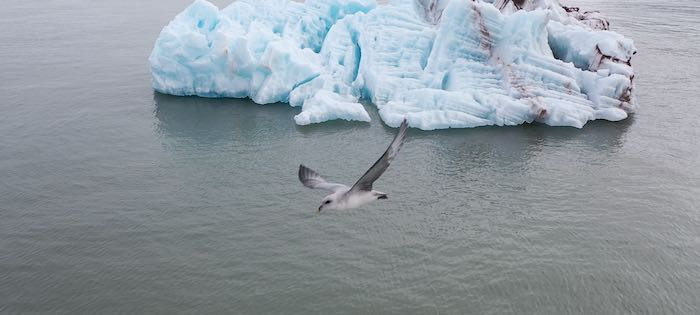
Iceberg with fulmarOne of the large icebergs in front of Kronebreen glacier this afternoon, with a fulmar flying right in front of the drone!

What about all that CTD and water sampling?

I thought I’d write a little about the CTD work that we’re doing. Xander has really taken charge of analyzing the data, although we’re all pitching in with the data collection. The CTD, which stands for “Conductivity, Temperature and Depth” is designed to help us measure the salinity (from electrical conductivity) and temperature and various depths. This device is also equipped with a turbidity sensor which can measure how turbid, or cloudy, the water is. (This is valuable for knowing how much sediment is in the water.) Here is a video from earlier in our field work demonstrating how the CTD process works.
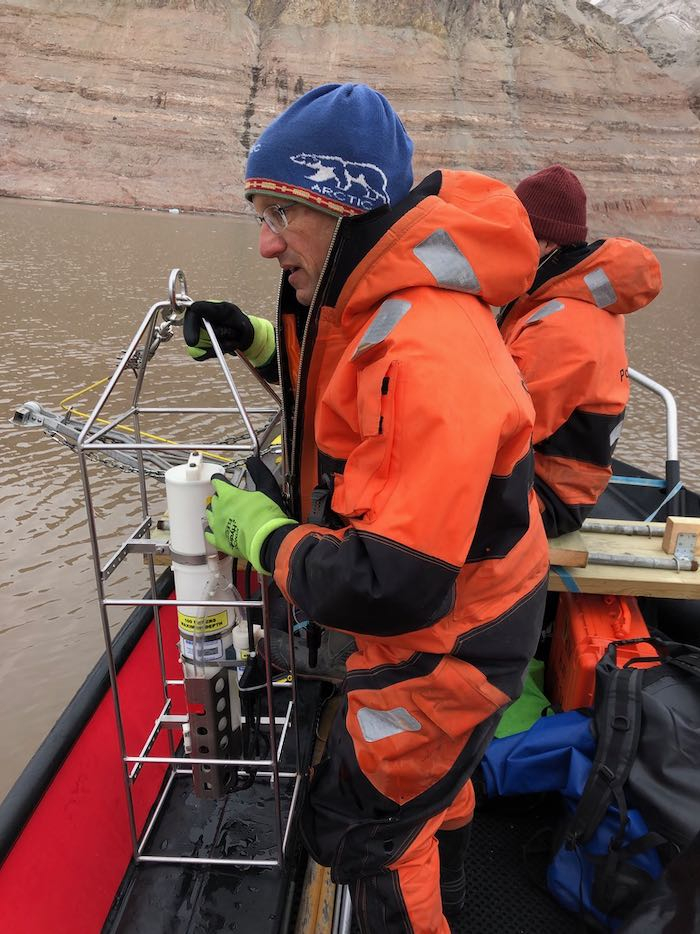
Setting up a CTD castI’m getting ready to lower the CTD instrument into the water.

The turbidity sensor using something called OBS (optical backscattering). Essentially beams of light are sent out, and the amount of light that is reflected back to the instrument is correlated with the amount of sediment in the water (the turbidity). In order to make sure the measurements are accurate, the sampling device must be calibrated with a measurement of the amount of sediment in the water. So in order to do that, we collect samples of water at different depths and create a calibration curve.

The water sampling technique is pretty cool. There’s an open bottle with two caps that snap shut by a mechanical weight that is sent down a cable at the desired depth. In this video you can see Xander demonstrating how this device works. After the sample is collected, we bring it back to the lab where the water is vacuumed through a piece of pre-weighed filter paper. After the water is vacuumed through, the sediment is left behind. The sample is heated in an oven to boil off all the water, and then the paper is weighed. From there a measurement of grams of sediment per liter of water can be found. This is then used to calibrate the turbidity sensor.
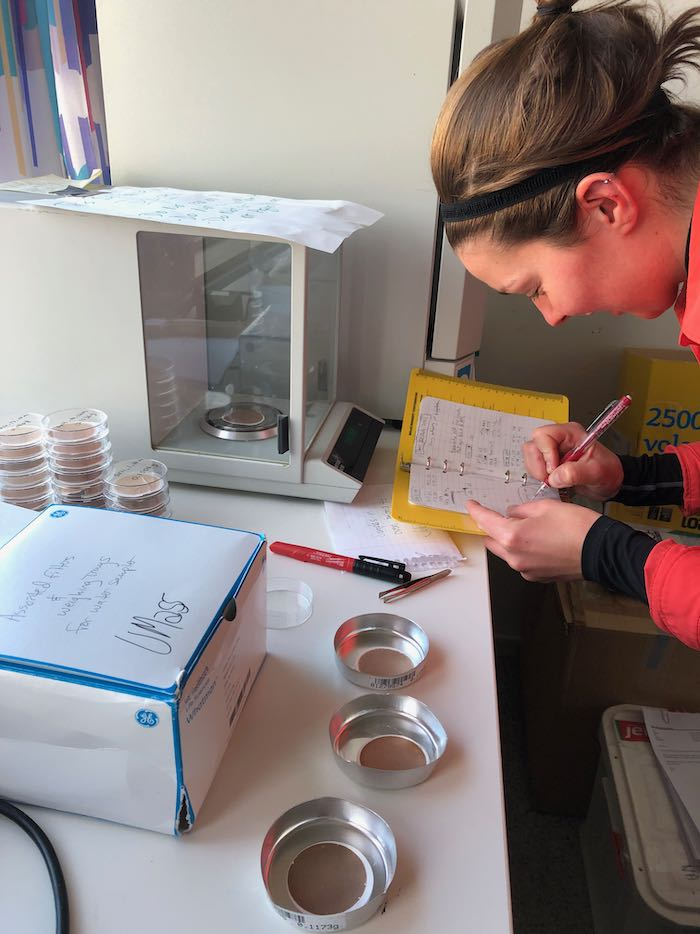
sediment weighingKelly is weighing the sediment samples after the water has been filtered and dried.

I thought it was cool to look visually at the samples before and after pulling out the sediment. Some of the samples look completely clear, but when the sediment is pulled out you can see how brown they are.
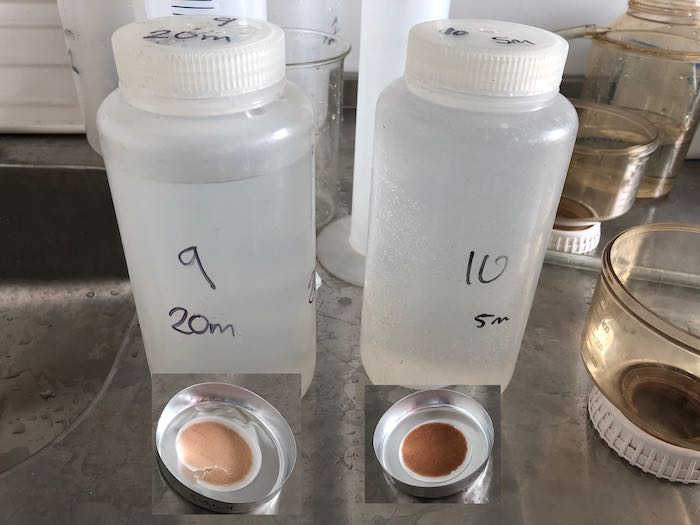
water samplesWater samples before and after filtering. Notice in this image that both bottles seem pretty clear. After sampling, you can see how there was plenty of sediment in the water. Also you can see that the darker one had a greater amount of sediment than the lighter one.

Then, I thought it would be interesting to arrange images of the dried filter paper by location and depth. In the image below (from a region in front of Kongsvegen Glacier), you can see the sediment at different depths along a line coming off the glacier face. This is a very simple way of visualizing the sediment plume as it comes off the glacier. It’s clear from this visualization that the sediment is darkest closer to the glacier, and closer to the surface.
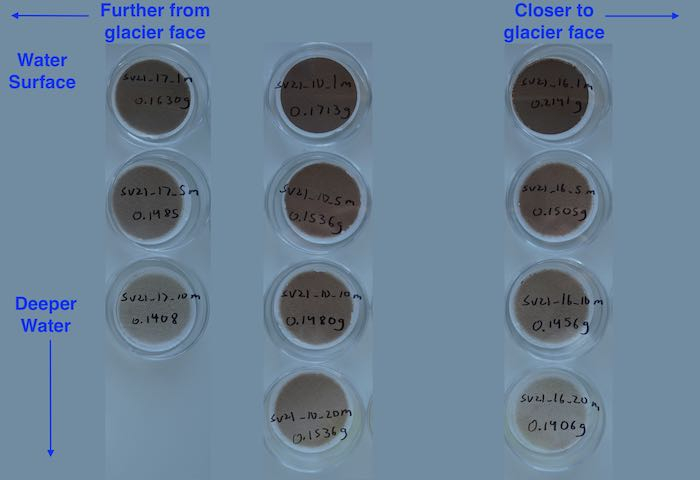
Sediment samples by depth and distanceThese images are from the water samples that were taken from different distances from the glacier face within a sediment plume, after they were filtered and dried. Basically, the darker the paper the more sediment is in the water.

If you look at a drone image of this sediment plume from Kongsvegen Glacier you can get a sense of just how much sediment is coming off the glacier. The plume is the brown water without icebergs coming up from the bottom left of the photo. There are no icebergs there because the water current of the plume is probably pushing icebergs out of the way. The water samples were taken from along this plume.
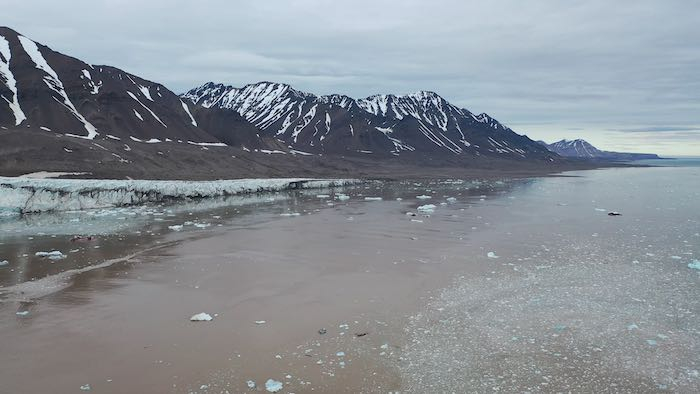
sediment plume in front of Kongsvegen GlacierThe sediment plume in front of Kongsvegen Glacier.

From the filter paper images you can get a sense of how the sediment stays on top. This is because of density - the freshwater coming off the glacier is less dense than the saltwater of the ocean, so it rises and stays on top. What I find interesting is how long it takes for all this water to mix!

The CTD graphs show the profile of turbidity, salinity and temperature. The y-axis (vertical) is depth from the surface (zero) down to 40 or 50 meters. There are 3 different things being graphed on the X-axis. The Green lines show Temperature, the Blue lines are Turbidity (how cloudy the water is) and the Brown lines show salinity (how salty the water is). (There are two lines because the CTD device collects data on the way down and again on the way back up.) I overlaid the filter paper images on top of the CTD images to help you get a sense of how the turbidity matches with the amount of sediment in the water. (Note that the scales are different in the two images!)
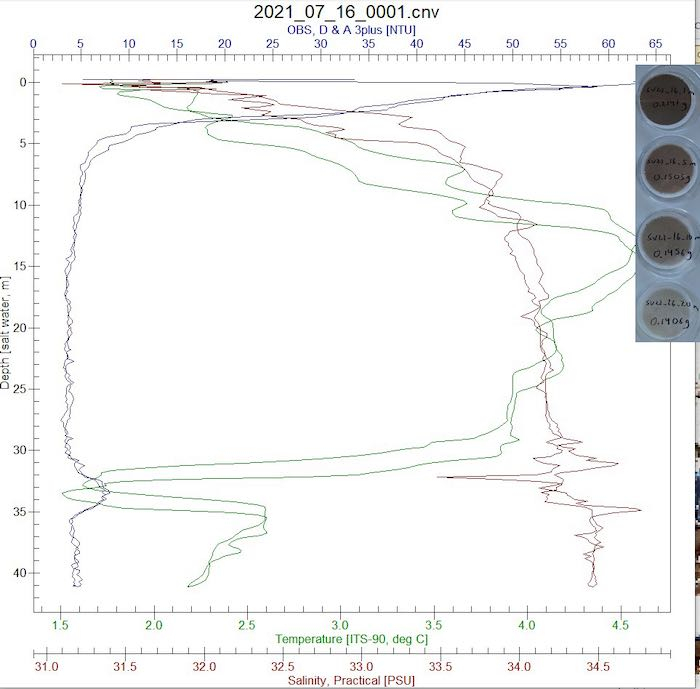
CTD example graph 1In this graph focus on the turbidity (Blue lines). Notice how it is more turbid (cloudy) at the top and then it goes way down. You can also see that in the images from the filtered water! Compare this to the next image which was from farther away from the glacier. CTD example graph 2In this graph focus on the turbidity (Blue lines). Notice how it is more turbid (cloudy) at the top and then it goes way down. You can also see that in the images from the filtered water! Compare this to the previous image which was from closer to the glacier.
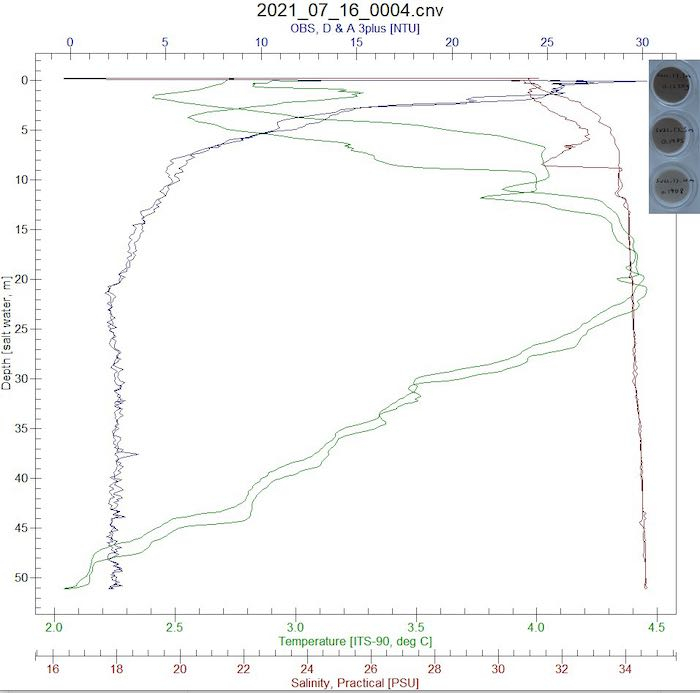
I know this can be kind of confusing at first, but the idea here is that Julie wants to take the CTD data from this year and compare it to previous years. In this way, she hopefully will be able to get a good sense of how the way sediment and meltwater flow off the glacier is changing over time.

Polar Connect Zoom Event!

A reminder that Monday at 3:30 Eastern Time we are hosting a live Zoom event! Anyone is invited to join us! You can register at this link. And, if you can’t make it, the event will be recorded.

Comments

Meredith Richardson

Mr. Goldner,
Firstly, I think the footage you captured of the icebergs is very *cool* indeed (pun fully intended.) I'm excited to take a closer look at runnels in your next post--how and why exactly does the water flow up?
Regarding the CTD/OBS, I find it particularly interesting how (relatively) simple the water sampling technique is: correct me if I'm wrong, but from what I understand, it's basically just a weighted bottle on a pulley system...!
Although I'm not sure you've already answered my next question, here it goes: *how* do you create the CTD graph? Does the CTD automatically generate it? Or do you map it yourself? If the latter, than is there a specific software that you use?
I'm looking forward to attending the live zoom event.
Sincerely,
-Meredith

Mark Goldner

Hi Meredith, thanks for your questions! (And your pun is great!) The answer to your first question is that the water flows up because it is freshwater hitting saltwater. Since freshwater is less dense than saltwater, it rises to the top. There is so much water coming out from under the bottom of the glacier in some places that it is under high pressure. All that water then shoots up, and carves the runnels into the side of the glacier. Then, when an iceberg calves off, if the carved face of the glacier can be exposed, like you saw in the picture.

You're right - the water sampler and the CTD are lowered down using a cable that is on a simple winch system (the mechanism you see in the video) which helps you wind it up. The water sampler is really clever since it's all mechanical! It just snaps shut at whatever depth you want to take the water from.

The CTD graph is constructed using software that comes with the device (from the Sea-Bird Scientific company). These types of devices are actually very common for people studying ocean or lake water.

Kiki Suijten

Hello, Mr. Goldner
To begin with, I thought the data you collected was really interesting and I noticed a lot. For example, in the graphs I saw that the temperature changed a lot at the different depths to the surface, while the salinity and turbidity stayed about the same except when being around 0. This made me wonder why the amount of salt, cloudiness and the temperature changes so much around 0.
After seeing the data in graphs compared to how you get the data, my question was: what are the big steps you take to put your data in graphs or to get the filters? how long does this usually take? do you do this every day? and do you see big differences from the data of different days?
I'm looking forward to reading my second blog, so I can be able to compare it with the data in this blog and look if there are big changes.
I hope you enjoy the rest of your expedition,
Kiki

Mark Goldner

Hi Kiki! Great to hear from you. Your observation is really important; what it shows is that there is a "plume" of sediment coming off the glacier. The plume is a fast moving stream of meltwater from under the glacier that is filled with sediment. Since its freshwater hitting the saltwater of the ocean (and freshwater is less dense than saltwater), it rises quickly to the top of the ocean. Then as it moves away from the glacier it stays on top for a while until it has time to mix. This doesn't happen for hundreds of meters away from the face of the glacier. So, close to the glacier where we are doing our measurements, there is a layer of cloudy, colder, less salty water. Today we did some CTD measurements much farther from the glacier. I would expect to see a lot less of that water, since by then it has had time to mix with the ocean water. One of the things we are hoping to understand is how and why the plume of sediment-filled water changes over time.

As to your next question, collecting the CTD data is pretty quick. It only takes about 5 minutes to slowly lower and then raise the device into the water. We go down to 40-50 meters usually (unless we hit the bottom) and then back up. Then, when we get back to shore, the data is quickly downloaded from the device onto a computer. Then it only takes a few minutes to produce the graph. But, to calibrate the turbidity measurement we need to also collect water samples, filter those and weigh them. That process can take several hours. But we don't need to do that for all our samples; we only do that for a particular region of the fjord to make sure that the data from the device matches the type of sediment in the water of that region.

For your last question, we don't really have enough data yet to see changes day to day. Hopefully we'll be able to do that, but we might not be able to get enough data by this Thursday (when we leave here) to really see day to day changes.

Giulia Taranto…

Mr.Glodner,
It was nice to hear about the activities that you are doing it was especially exciting to hear about you getting a different point of view, while we are on the topic of icebergs I was wondering how long does it take for the runnels to form?
Now come my big question: Have there been any fossils found with the receding of the glaciers?
Thank you for taking this time to look at this.
Giulia

Mark Goldner

Hi Giulia, those are great questions! We don't really know the answer to how long it takes runnels to form, but it probably takes hours. You see, the glacier is moving forward at about 1 meter a day, and the water is moving upward pretty quickly. So I'd guess less than a day for runnels like the ones you see on icebergs to form.

As to your question about fossils, probably no. Glacier ice is under so much pressure, and the parts of the glacier are grinding into and past each other that any bits of bone or fossil would probably be destroyed by the time it made it to the ocean.

Zack

Hi Mr. Goldner,
I hope you are having lots of fun in Ny Ålesund, Svalbard. After reading your blog post I am amazed by how much sediment is actually coming off the glaciers. One question I have came when I saw your graph of the dried filters. And I was intrigued why there is less sediment the deeper you go into the water. While there is more at the top. Before I read this post. I figured that the sediment would sink to the bottom but when I learned it did the opposite it intrigued me.

Hopefully you can inform me more about it!
-Zack

Mark Goldner

Hi Zack, you raise a really good question! The reason the water has more sediment closer to the top is because the sediment-laden water is coming from the glacier, and that is freshwater. Freshwater is less dense than saltwater, and therefore it floats up on top of the saltwater. You are right, though, that eventually the sediment will settle out to the bottom of the water. But the water stays stratified (layered) for quite some distance before it eventually mixes to the point where the sediment will settle down to the seafloor. The other thing to understand is quite a bit of the sediment is made up of really small particles (like clay and silt) which are so tiny that they can stay suspended in the water for a long time.

Charlotte Pappas

Hello Mr. Goldner,

Foremostly, the data that your team collected about the temperature, turbidity, and salinity of the ocean surrounding the Kongsvegen Glacier using the CTD device seems interesting, especially since you took CTD samples from two different distances from the Kongsvegen Glacier, as it allows you could see how the temperature, turbidity, and salinity of the ocean at different distances from the Kongsvegen Glacier compare and contrast with each other.

For example, on the graph based on the CTD device samples taken from a part of the ocean closer to the Kongsvegen Glacier, I noticed that the water closer to the surface of the ocean in that area had a greater amount of turbidity, a lower amount of salinity, and a warmer temperature, as within the first 5 meters of the ocean, the water had an nephelometric turbidity unit of around 55 to 8, an practical salinity unit of around 31 to 32.5, and a temperature of around 2.5 degrees Celsius, but as the water sampled got closer to the bottom of the ocean, its turbidity levels went down, while its salinity levels went up, and its temperature dropped, as within 35 to 40 meters of the ocean, the water had an nephelometric turbidity unit of around 1.6, a practical salinity unit of around 34.45, and a temperature of around 2.2 to 2.45 degrees Celsius.

In addition, on the graph based on the CTD device samples taken from a part of the ocean further away from the Kongsvegen Glacier, I noticed that the water closer to the surface of the ocean in that area had a greater amount of turbidity, a high amount of salinity, and a warmer temperature, as within the first 5 meters of the ocean, the water had an nephelometric turbidity unit of around 20 to 30, an practical salinity unit of around 32 to 33, and a temperature of around 2.75 to 3 degrees Celsius, but as the water sampled got closer to the bottom of the ocean, its turbidity levels went down, while its salinity levels stayed relativity the same, and its temperature dropped, as within 45 to 50 meters of the ocean, the water had an nephelometric turbidity unit of around 2.25, a practical salinity unit of around 34.4, and a temperature of around 2 to 2.5 degrees Celsius.

Therefore, I then used these data patterns found on these graphs showing the CTD device results from areas of the ocean closer to and further from the Kongsvegen Glacier to make inferences and predictions about how the distance away ocean water is from a glacier affects its temperature, turbidity, and salinity levels, and I did this by looking for similarities and differences between the data from these two distances.
For instance, some similarities I found were that in both distances from the Kongsvegen Glacier, the temperature and turbidity levels tended to decrease as the ocean water got deeper, and the salinity levels tended to increase as the ocean water got deeper.
However, one difference I found between these two results from different distances from the Kongsvegen Glacier was that the temperature decrease as a result of the water getting deeper was much more consistent and noticeable in the results from the ocean water further from the Kongsvegen Glacier, while the temperature in the results from the ocean water closer to the Kongsvegen Glacier tended to overall get colder over time, but it also frequently increased more often then the results from the ocean water further from the Kongsvegen Glacier.
Hence, from these observations I made on the data patterns found on these graphs showing the CTD device results from areas of the ocean closer to and further from the Kongsvegen Glacier, I made an inference that this data is showing that overall, the distance away ocean water is from a glacier does not have a large factor in the temperature, turbidity, and salinity levels of the ocean water, but when ocean water is closer to a glacier, its temperature tends to fluctuate more often between increases and decreases then ocean water further away from the glacier.

Withal, one wondering that I have about this post is that does the distance ocean water is from a glacier, or any form of sea ice, have a large factor in the temperature, turbidity, and salinity levels of the ocean water, as the data from these graphs did not seem to show any changes in the temperature, turbidity, and salinity levels of the ocean water, but this is just one sample, and I question if there is other data that shows the opposite of my inferences.

That is all of my thoughts for now.
Charlotte

Mark Goldner

Hi Charlotte, your question is really important - we do expect to see changes as we get farther from the glacier face. For example, we'd expect to see the water get less turbid, and warmer. As we get farther from the glacier we'd expect to see the water layers eventually begin to mix. Also we were expecting to see warmer water much farther from the glacier as Atlantic water moves in. However, this year it seems that the Atlantic water is coming into the fjord much later than usual so we never saw evidence of warmer, saltier water from the ocean coming in (at least in the three weeks we were there).

Eric Bardon

Hi Mr.Goldner,

I hope you had a great time in Ny Ålesund. I was looking at the photos and information you collected and what surprised me was how the sediment floated on top near the glacier and fell to the bottom farther away from the glacier. I was also very surprised how the water barely mixed and you could see a clear difference. I was also read about how the turbidity sensor worker, I was amazed at how advanced it was and how it can track the amount of sediment in the water from a light beam. One question I had was since the last time you went to Ny Ålesund could you tell a difference in the size of the glaciers or amount of snow/ice there was?

Thanks, Eric

Mark Goldner

Hi Eric, all of the glaciers that we observed were much smaller this year than they were ten years ago. For example, the margin of the Kronebreen and Kongsvegen Glaciers have each retreated about a mile from where they were in 2011. They have also become thinner, although that was not something we were equipped to measure. If you haven't had a chance to read it, you might want to look at this blog post where I share some visuals showing how far the ice has retreated.

sean c

hello Mr. Goldner
Do you have any free time and if so what do you with that free time?
sincerely Sean C.

Mark Goldner

Hi Sean, once we got up to Ny Ålesund we didn't really have much free time! Our work was pretty time-consuming. But during the few moments of free time, we enjoyed working out in the small gym they have there and playing a few games of pool (yes, there was a pool table upstairs from the dining hall!).

Mia Jones

Hi Mr. Goldner!
I know you're back from the trip now, but I think you'll still be able to answer my questions. I'm sorry I couldn't be there for the live event, it sounded cool! My question is, how are the graphs made? I'm imagining a fancy google spreadsheets-looking thing. Also, I'm curious, were you able to compare and contrast your findings from those of previous years? If so, what did you find? I hope you learned a lot and had a great time on your trip!
Thank you,
Mia Jones

Mark Goldner

Hi Mia, you are basically correct. The data comes out of the CTD device in a simple database format that can be read by different types of software. In fact, it could be brought into Google Sheets if you wanted it to!
As to your other question, we haven't yet had time to compare and contrast with previous years in any significant way. The only thing we noticed right away, which I've written about a little, is that in previous years we would have expected to see warmer water coming in from the open ocean; this year we didn't see that happening. Why that is the case is not totally clear.

Acacia Fitzgerald

Hey Mr. Goldner,
I hope you great time at Ny Ålesund!
I noticed on your Saturday hike you said you had brunch from 10 - 11. I was wondering where and what you ate? Did you and your group cook for yourselves? Are there places that people can go to eat in Ny Ålesund?
What was the weather range where you were? I noticed in a few images I saw that people were wearing a shirt underneath a jacket. Was that enough to not feel cold in the Arctic? Or did you need to dress in layers to feel somewhat warm?

Mark Goldner

Hi Acacia, thanks for your questions. I guess I didn't explain very well how the research base is set up. We always ate in the dining hall, and I would have loved to take some pictures but for some reason they have a "no pictures" policy in the dining hall! So the staff at Ny Ålesund includes several very talented chefs who prepared very healthy and delicious meals for us! As a vegan, I was a little worried that there might not be food for me, but it turns out that I am not alone - there were several vegans among the scientists, and the chefs prepared plenty of excellent vegan food. The meals really varied and there was always a lot of fresh fruit and vegetables! (They get food shipped up by boat every few weeks.) Ny Ålesund is set up really just for scientists, so there aren't restaurants, etc. Fortunately for us the food was excellent!

The weather ranged from the low 30's (Fahrenheit) to the high 40's. Mostly it remained in the high 30's. But if it was sunny and in the 40's with no wind, it could certainly be t-shirt weather! However, when you are out on a boat where the water temperature is just a little above the freezing point, and if it was at all windy and cloudy, it could feel very cold! Here's a little goofy video I took to show you how many layers we had to put on every morning before going out on the fjord.

Micheal Siedlecki

Dear Mr. Goldner
I thought it was really cool how the last time you visited the Arctic you were able to go in the freezing cold water. Adding on to that comment, I was wondering if you were able to go in that water again, and if so, was the temperature of it different at all.

Mark Goldner

Hi Micheal, no we didn't get a chance to go swimming this time around. We were just too busy, and the air temperature was never really warm enough where it felt like we wanted to do that!

Sonia Wexler

Hi Mr Goldner,

What you said about the runnels was very interesting! How does the water go up the glacier? Why does it make those marks? Does the water go up overtime, or does it happen really fast. Also, what was the average tempeture while you were in svalbard?

Thanks,
Sonia

Mark Goldner

Hi Sonia, yes it's a little hard to understand. But the basic idea is about density. Substances that are less dense will float on substances that are more dense. Salt water is more dense than freshwater, so freshwater when it is poured into salt water, will remain on top. The water coming off the glacier usually flows out from the bottom of the glacier. When it hits the salty ocean water, it rises up. It's also under a lot of pressure, so there's a lot of water coming out at once. All that freshwater, flowing up at the front of the glacier, carves the runnels into the glacier face. As far as I understand, it can carve out a pretty large amount of ice pretty quickly.

The average air temperature was in the high-30's to low-40's most days.

Sage Kapusta

Hi Mr Goldner,
It is just so devastating how much climate change has effected the arctic glaciers and the animals. While your traveled the area studying the glaciers did you happen to see any animals? Did you notice a changed in behavior or "looks" from the last time you visited the arctic?

Sincerely,
Sage Kapusta

Mark Goldner

Hi Sage, it's a little hard for me to answer the question, because we did see differences in the animals, but I don't think that's necessarily because of changes in the glaciers or global warming. For example, ten years ago we hardly saw any foxes, but this year we saw many. I think that is just a normal cycle of population growth and decline that happens to different species. We also had more polar bear activity than last time, but when you just pop in a couple of times over a ten-year span it's really hard to draw any conclusions about that.

Natasha

Dear Mr. Goldner,
I hope you great time at Ny Ålesund! I was wondering were did you have lunch? Were there some restaurants or supermarkets near by were you could get food? Do any people live there? I was also wondering were there any animals if so witch were your favorite. Is it always cold there or do they have a summer if so is it ever hot? I would love to go there one day it seems like so much fun! I really enjoyed all the photos that you took there looks so fun!

Sincerely,
Natasha

Mark Goldner

Hi Natasha, most days we would eat lunch out on the boat. After breakfast (all meals were in the communal dining hall), the cooks would put out lunch food and we would make our own lunches and pack them up for us on the boat. (We were careful to put them into a dry bag so they didn't get wet!)

Ha, no the location is so incredibly remote that the only people for hundreds of miles were in this little research village with around 100 people. There was a tiny store open only twice a week (for an hour) where you could buy snacks and things, but no markets or restaurants! We always ate together with the other scientists. I wish I could have taken photos of the dining hall and the food to show you, but for some reason they have a strict no-photos rule in the dining hall!

So, the definition of summer is about the location of the Earth relative to the Sun and how the Earth is tilted. During the summer, you are on the part of the Earth that is tilting towards the Sun, and in winter you are on the part of the Earth tilting away. (Here's a little overview of how that works.) So we were indeed in summer, and had 24-hours of daylight to prove it! But because we were so far North, and the angle of the Sun's light remains low, it always stayed pretty cold. In the winter, it's even colder!

Gwen

Dear Mr. Goldner,

I enjoyed observing the graphs of the sediment and learning about how you and the other researchers used the CTD instrument. I was curious if the sediment has the same results year round. Would the color and texture be different in the winter from the summer? As I watched the video of the turbidity sensor it made me think about my summer swimming in the ocean, and how much sediment exists that I don't see in the Atlantic Ocean. My last question was I noticed with all your layers it must have been pretty cold, how cold was it?

Sincerely,
Gwen

Mark Goldner

Hi Gwen, thanks for your great questions! I'm not completely sure of the answer to your first question, but I would guess that the water is more turbid (cloudy) in the summer, because there is more melting - and therefore, more sediment flowing into the ocean. In the winter, there would be less water flowing into the ocean, which would give the sediment time to settle down to the bottom.

It was not quite as cold as you think - the air temperature was usually in the mid-30's to mid-40's. But the water temperature is also cold, and since water is really good at pulling heat away from you, and since the boat was not well insulated, it always felt pretty cold out on the water. And if it was at all windy or rainy, that made it feel even colder!

Saige Clayton

Hello Mr.Goldner,
I really enjoyed reading your blog and how detailed it was it made it very easy to understand and follow along. One question I had for you is how long did it take to do all the test you conducted? I saw so much wonderful work and the first question that popped in my mind was how long did it take. I know one part of the CTD is temperature. I was wondering if the weather outside had anything to do with how the test might turn out , what was the temperature outside when you where conducting the research for the plume?

All the best,
Saige

Mark Goldner

Hi Saige, to do one CTD cast only took a few minutes. If you watch this video, you'll get a sense of it. Of course it's sped up in the middle, so just add about 5 minutes to the total time. So the weather really doesn't have much effect because we're measuring the temperature of the water, and the weather affects the temperature of the air. Water takes a long time to heat up or cool down, so in just a day or so you wouldn't see much change in the water temperature.

The air temperature was pretty consistently in the high 30's or low 40's the whole time we were there.

Ilana

Hey Mr. Goldner,
I hope you wonderful time at Ny Ålesund! I just thought that it was so wonderful that you could have the access to go hiking in such a nice environment were you could go on amazing adventures and explore all of the amazing animals around you. I also thought that the data that you collected was very interesting especially how the water samples that you made could change colors based on how much sediment from the glacier there was.

A question that I have was how large could the sediment get up to, could it become almost black if there is a certain amount of sediment?
Also another question that I had in mind was what was your best part about the research that you did if you did have a part that you liked most?

-sincerely,
Ilana porkhovnik

Mark Goldner

Hi Ilana, I think you're asking how much sediment the water can hold - I think the water there was pretty saturated with sediment. Much more and the the sediment would fall out of the water.

By far the best part of the research was flying the drone - I was able to see parts of the glaciers and the fjord up close that I had never seen before!

Erin Paik

Dear Mr. Golder,

It seems as though you had a lot of fun in Ny Ålesund, Svalbard! It looks extremely cold but beautiful there. It must've been tiring suiting up each and every day. After watching the drone footage of the glaciers, I was amazed at how clearly you could see the sediments in the glaciers. The glaciers were also very pretty. After reading about the CTD, I thought about how cool it was to have equipment like that. Also, when you arranged the sediment samples by location and depth, I thought it was very cool how you could see the gradual color change based on how deep the water sample was and how far away from the glacier it was.

As for my question, what was the average water temperature when you were there?

- from
Erin

Mark Goldner

Hi Erin, the average water temperature was around 4-5°C (which is around 39-41°F).

Ben Dankwerth

Dear Mr. Goldner,

You have summarized the what your doing pretty nicely. One thing I notice is that you said "In this way, she hopefully will be able to get a good sense of how the way sediment and melt water flow off the glacier is changing over time." What I'm wondering is, what kinds of things can you figure out with changes in sediment and melt water flow? Thanks.

Sincerely,
Ben Dankwerth

Mark Goldner

Hi Ben, it's a little complicated, but understanding how the sediment and meltwater flow change over time can help us get a better picture of how water flows through and out of the glacier. It's not well understood exactly how water flows through glaciers. This can be helpful in making predictions for the future - as the atmosphere warms and melting increases, how that affects the flow of glaciers is important to know.

Natasha

Dear Mr. Golder,
Ny Ålesund sounded really cold but also really fun. Some questions I have are did it ever rain there? If so how much? What was the average temperature while you were in Svalbard? Is there any plants around? If so what type were they? What was the coolest thing you ever saw there? Was the water warm enough to go swimming in the water there.

Mark Goldner

Hi Natasha, thanks for your questions. It does rain sometimes, but not a lot. The climate is actually pretty dry. The average temperature was probably around 40°F for the time we were there.

There are some small plants, mostly short grasses and tiny flowers. I am not an expert on plants, so I don't know their names. But near the shore where the ground is relatively flat, there's enough soil to support small plants. Reindeer and geese depend on those plants for food.

The coolest thing I saw was definitely the icebergs calving. You can check out this video of one of the icebergs calving that I was able to film.

The water is never really warm enough to swim... but last time I was there the air got pretty warm (like mid 50's) so we took a short dip! This time it never felt warm enough to do that.

Natasha

Sincerely,
Natasha Griffin

Wally Lawrence

Hey Mr. Goldner!

Is there a way to make you own turbidity calculator? Can you measure the turbidity using something at home?

Add new comment